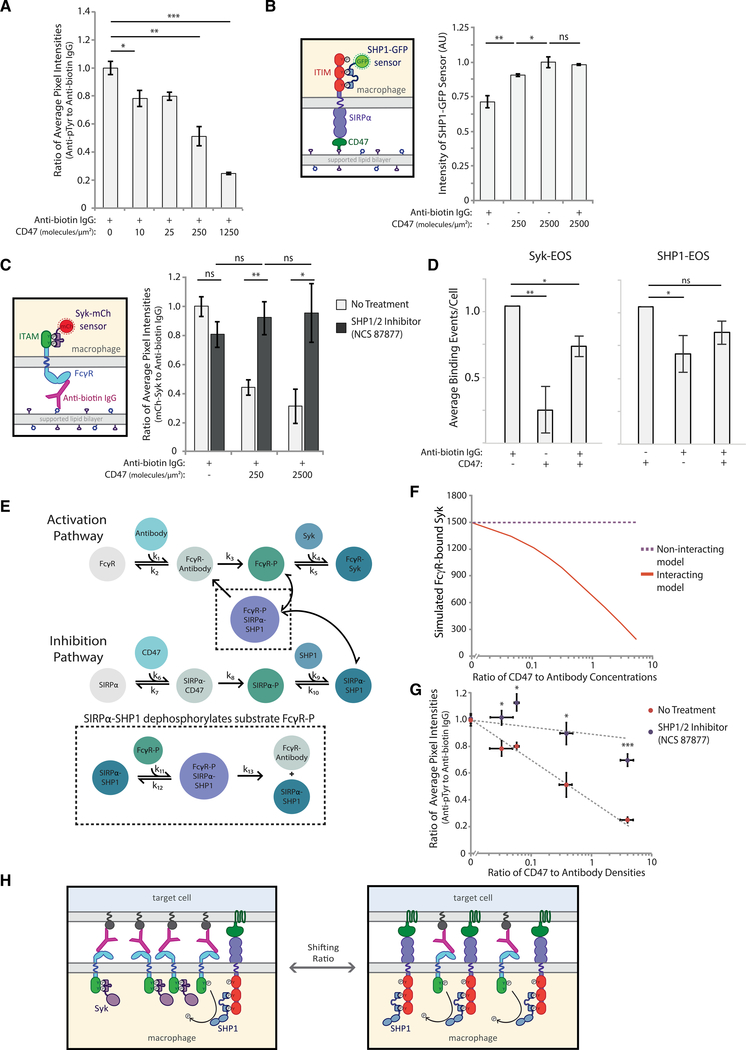
Figure 3. SIRPα-bound SHP1 dephosphorylates activation pathway to inhibit phagocytosis.
(A) Quantification of the ratio of anti-phosphotyrosine to anti-biotin IgG fluorescence at macrophage-bead interfaces. RAW 264.7 macrophages interacting target particles coated with a fixed density of anti-biotin IgG (300 molecules/μm2) and variable CD47 (0–1250 molecules/μm2). Each condition is the average of three independent experiments representing a total of >150 particle-cell interfaces. Bars represent means ± SEM. Conditions were compared with two-tailed Student’s t test. *p < 0.05, **p < 0.01, ***p < 0.001.
(B) Schematic of SHP1-GFP sensor for detection of phosphorylated SIRPα (left panel). Average SHP1-GFP fluorescence signal within cell footprints was quantified for cells on SLBs coated with different CD47 densities (0, 250, and 2,500 molecules/μm2) with and without anti-biotin IgG (300 molecules/μm2) (right panel). Each condition is the average of three independent experiments representing a total of >100 macrophage footprints. Bars represent means ± SEM. Conditions were compared with two-tailed Student’s t test. *p < 0.05, **p < 0.01.
(C) Schematic of Syk-mCh sensor for detecting phosphorylated FcγRs. RAW 264.7 cells expressing Syk-mCh sensor were imaged on SLBs coated with anti-biotin IgG (300 molecules/μm2) and a range of CD47 densities (0, 250, and 2,500 molecules/μm2). Average fluorescence signal within the cell footprint was measured for anti-biotin IgG and Syk-mCh, and the ratio of Syk-mCh to anti-biotin IgG was quantified for each cell. Cell footprint fluorescence was measured for cells with no pre-treatment (light gray bars) and with treatment with SHP1/2 phosphatase inhibitor NSC-87877 (dark gray bars). Each condition is the average of three experiments representing a total of >200 cell footprints. Bars represent means ± SEM. Conditions were compared with two-tailed Student’s t test. *p < 0.05, **p < 0.01.
(D) Normalized average Syk-EOS (left) and SHP1-EOS (right) binding events per cell for RAW macrophages on SLBs containing anti-biotin IgG (300 molecules/μm2), CD47 (2500 molecules/μm2), or both. Each condition is the average of three independent experiments representing a total of >50 macrophage footprints. Bars represent means ± SEM. Conditions were compared with two-tailed Student’s t test. *p < 0.05, **p < 0.01.
(E) Schematic of computational model combining activating (top) and inhibitory (bottom) pathways. SIRPα-SHP1 dephosphorylation of FcγR captured in the black dotted inset represents the “interacting” version of the model.
(F) “Interacting” and “non-interacting” models were initiated with a fixed-antibody concentration and variable CD47 concentrations, yielding a range of CD47:antibody ratios. Each model for each ratio condition was run until the steady state was reached, and FcγR-bound Syk was plotted.
(G) Ratio of anti-phosphotyrosine to anti-biotin IgG at macrophage-target interfaces was measured for a range of CD47:antibody ratios on target particles, as described in (A). Quantification was done with and without pre-treatment of macrophages with SHP1/2 phosphatase inhibitor NSC-87877. Each condition is the average of three independent experiments representing a total of >150 particle-cell interfaces. Dots represent means ± SEM. Conditions were compared with two-tailed Student’s t test. *p < 0.05, ***p < 0.001.
(H) Schematic of SHP1-facilitated shutoff of activation pathway. In the absence of CD47, FcγR ITAMs are phosphorylated and bind Syk kinase, promoting phagocytosis. Upon CD47 engagement and SIRPα ITIM phosphorylation, SHP1 phosphatase is brought in close proximity to phosphorylated ITAMs, enabling their dephosphorylation.

