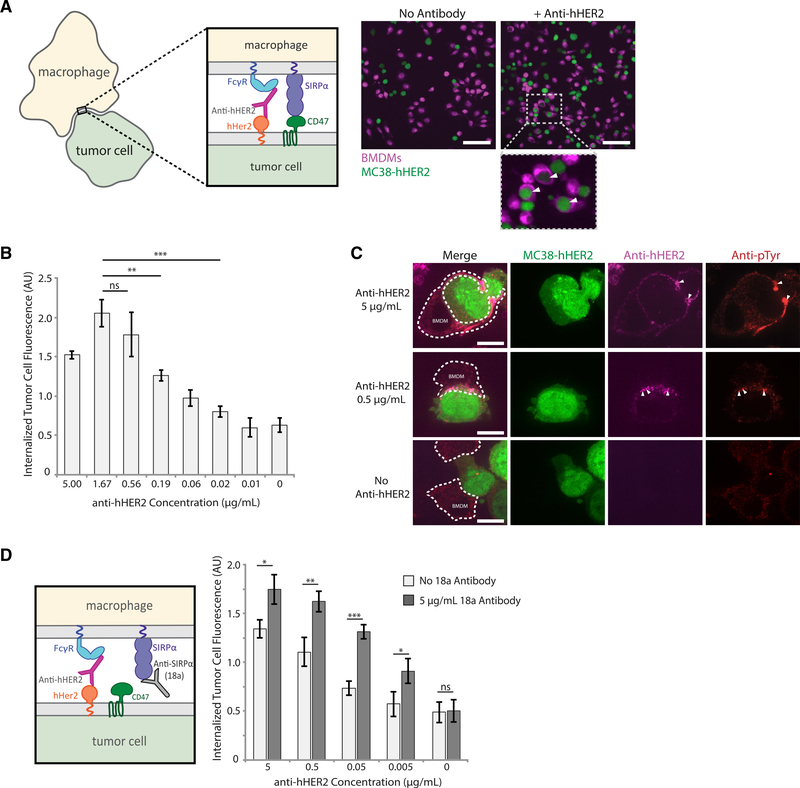
Figure 5. Tumor cell phagocytosis is dictated by activation-inhibition ratio.
(A) Representative confocal images of bone-marrow-derived macrophages (BMDMs, magenta) incubated with MC38-hHER2 cells (green), either with or without tumor targeting anti-hHER2 antibody opsonization. White arrows within insets indicate phagocytosed MC38-hHER2 cells. Scale bar is 50 μm.
(B) Quantification of MC38-hHER2 tumor cell phagocytosis by BMDMs. MC38-hHER2 tumor cells were opsonized with a range of anti-hHER2 antibody concentrations (0–5 μg/mL). Each condition is the average of three independent experiments representing >150 total cells. Bars represent means ± SEM. Conditions were compared with two-tailed Student’s t test. **p < 0.01, ***p < 0.001.
(C) Fluorescent confocal images of fixed BMDMs engaging with MC38-hHER2 cells (green) opsonized with different concentrations of anti-hHER2 antibody (0,0.5, and 5 μg/mL, magenta). Phosphorylation visualized via anti-phosphotyrosine (red). BMDM outlines are shown in white dotted lines. Areas of high anti-hHER2 enrichment are highlighted with white arrows. Scale bar is 5 μm.
(D) Anti-SIRPα blocking antibody 18a interrupting SIRPα binding to CD47 (left panel). MC38-hHER2 cells incubated with a range of anti-hHER2 antibody concentrations (0–5 μg/mL) were added to BMDMs in the presence or absence of 5 μg/mL of 18a antibody. Average tumor cell phagocytosis was quantified (right panel). Each condition is the average of three independent experiments representing >150 total cells. Bars represent means ± SEM. Conditions were compared with two-tailed Student’s t test. *p < 0.05, **p < 0.01, ***p < 0.001.

