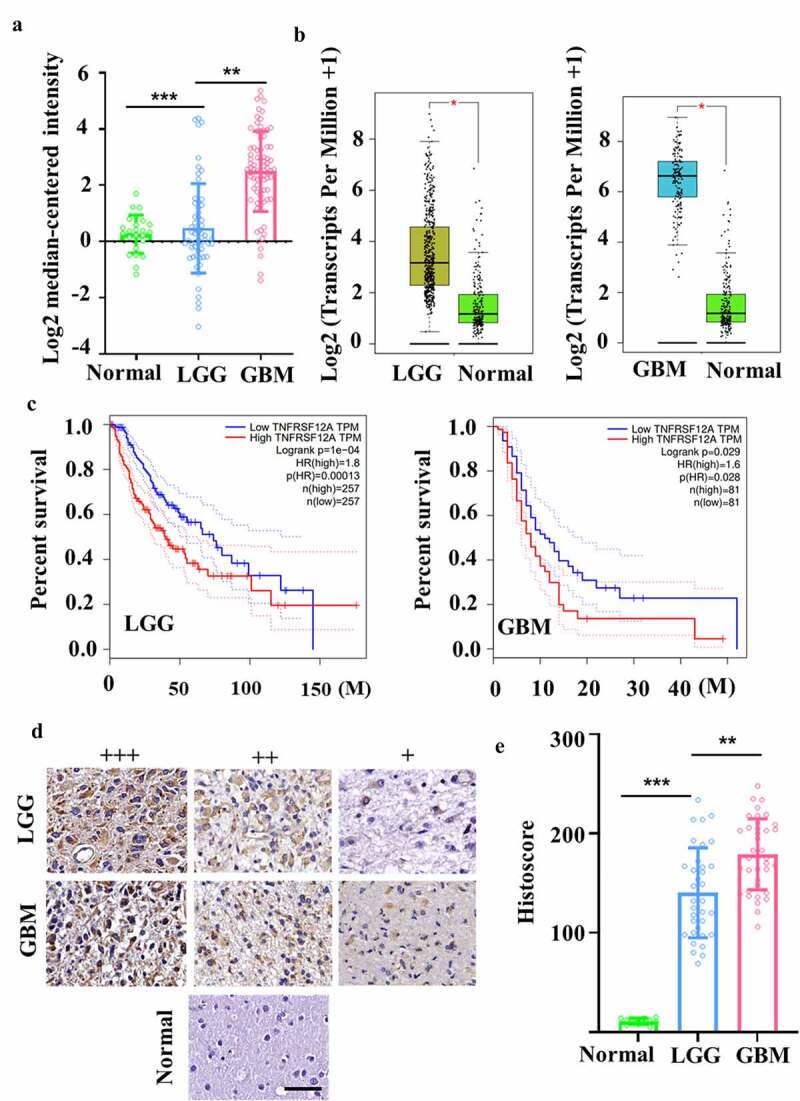
Figure 1.

Evaluation of Fn14 expression in gliomas. (A, B) Differential expression of Fn14 in normal, LGG and GBM tissues was analyzed in microarray and RNA-seq datasets from Oncomine and TCGA databases. (C) Correlational analysis between disease-free survival and Fn14 expression in LGG and GBM based on GEPIA. (D) Representative staining of Fn14 in normal, LGG and GBM tissue. Scale bar, 20 μm. (E) Histopathology scores of Fn14 in normal, LGG and GBM tissue. *P < 0.05; **P < 0.01; ***P < 0.001
