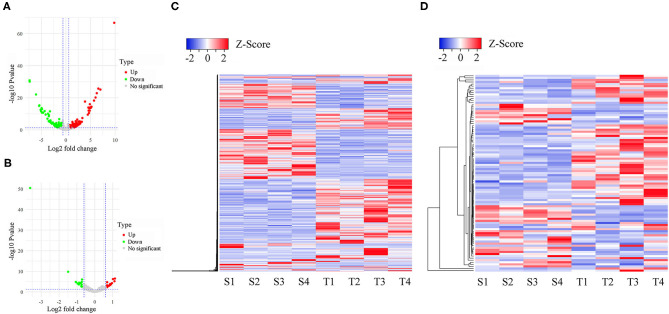
Figure 2.
Differentially expressed lncRNAs and mRNAs in susceptible and tolerant pigeons infected with Trichomoniasis gallinae. The volcano plot of differentially expressed lncRNAs (A) and mRNAs (B). The significantly up- and down-regulated candidates are presented as red or green dots, respectively, the gray dots represent transcripts whose expression levels did not reach statistical significance (fold change > 1.5 and P < 0.05). (C) Cluster analysis of differentially expressed lncRNAs. (D) Cluster analysis of differentially expressed lncRNAs. S1–S4 denotes susceptible birds, and T1–T4 denotes tolerant birds.

