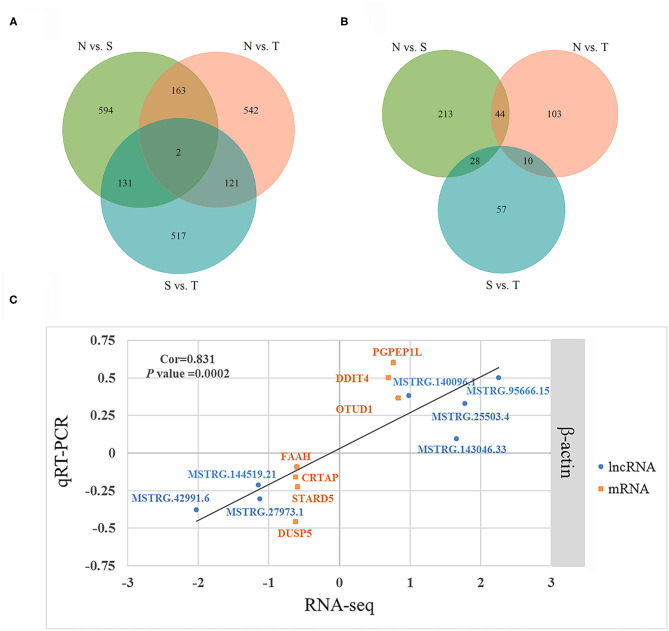
Figure 3.
Differentially expressed (DE) lncRNAs and DE genes among birds during Trichomoniasis gallinae infection. (A) Venn diagram of DE lncRNAs among control (N), susceptible (S), and tolerant (T) birds. (B) Venn diagram of DE genes among control (N), susceptible (S), and tolerant (T) birds. (C) Correlations of gene expression level of 7 DE genes and 7 DE lncRNAs using RNA-Seq and qPCR. The x- and y-axis represent the relative expression levels measured by RNA-seq and qPCR, respectively. β-actin were used as internal control. The orange and blue dots represent the DE genes and DE lncRNAs, respectively.

