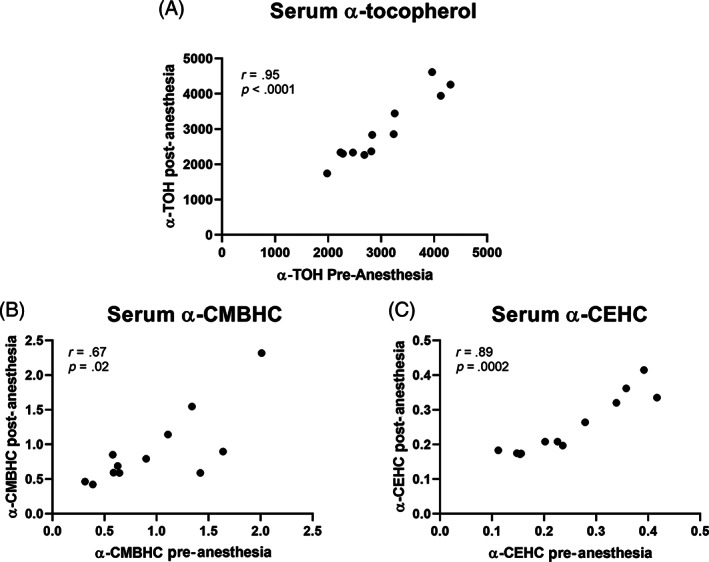
FIGURE 3.

Proof of concept study—Anesthesia and measured compounds: Scatter plots showing the significant positive correlation between pre‐ and postinduction (A) α‐TOH, (B) α‐CMBHC, (C) α‐CEHC. Correlation r values calculated from a Pearson (A) or a Spearman correlation (B and C). All units are in ng per mL of matrix
