FIGURE 7.

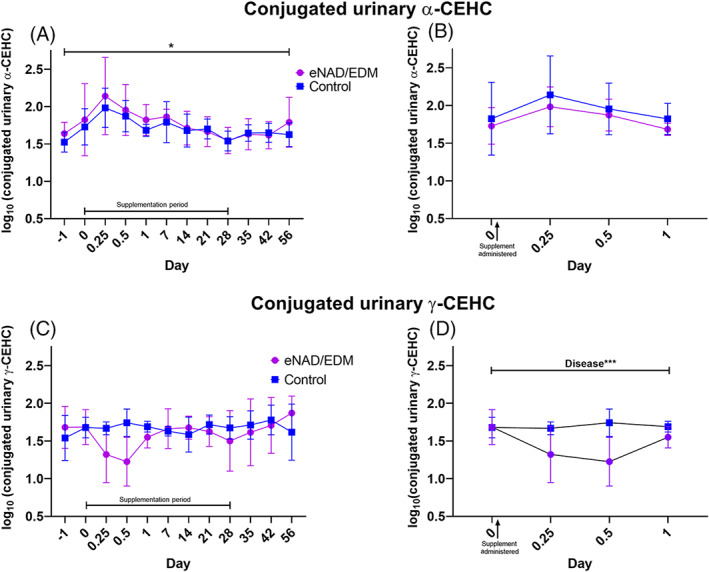
Proof of concept study—Conjugated urinary γ‐, but not α‐metabolites, differ between eNAD/EDM and control horses: A, Conjugated urinary α‐CEHC concentrations changed significantly over time in all groups (*P < .05) during the 56‐day trial period, with no effect of disease. B, Within the first 24‐hours time period, conjugated urinary α‐CEHC concentrations did not significantly differ over time or between disease states. C, For conjugated urinary γ‐CEHC, there was no significant effect of time or disease but a significant interaction was observed for time × disease (P = .01) over the 56‐day course of the study (D) Within the first 24‐hours period, time was not significant, however eNAD/EDM‐affected horses had significantly less conjugated γ‐CEHC metabolites in their urine (P = .04) and a significant interaction was observed between time * disease (P = .02)
