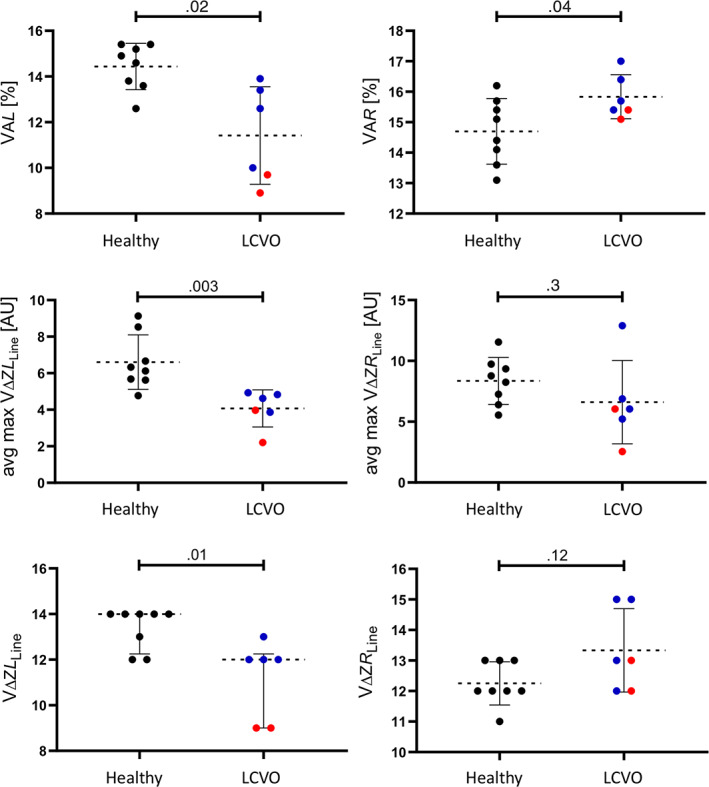
FIGURE 2.

Scatter plot graphs of nonconventional electrical impedance tomography (EIT) variables evaluated from healthy horses (n = 8, black dots) and horses with compensated (blue dots) and decompensated (red dots) left‐sided cardiac volume overload (LCVO; n = 6) describing the ventilated area over the right (VAR) and left (VAL) lung field, average maximum impedance change (right: avg‐max VΔZR Line; left: avg‐max VΔZL Line) and amount of ventilated matrix lines (VΔZR Line; VΔZL Line)
