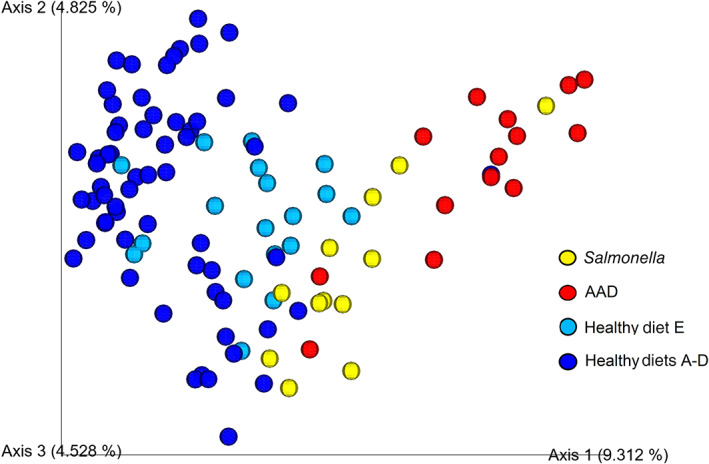
FIGURE 4.

Principal coordinate analysis plot of unweighted UniFrac distances shows distinct clustering of horses with antimicrobial‐associated diarrhea (AAD) (red) and Salmonella (yellow) colitis from healthy horses on diets A‐D (royal blue) and diet E (light blue) (overall ANOSIM, R = 0.565, P < .001). There is statistically significant but less distinct separation of the 2 types of colitis horses from each other (AAD vs Salmonella; ANOSIM, R = 0.226, P < .001) and healthy horses on diets A‐D from those on diet E (ANOSIM, R = 0.287, P < .001)
