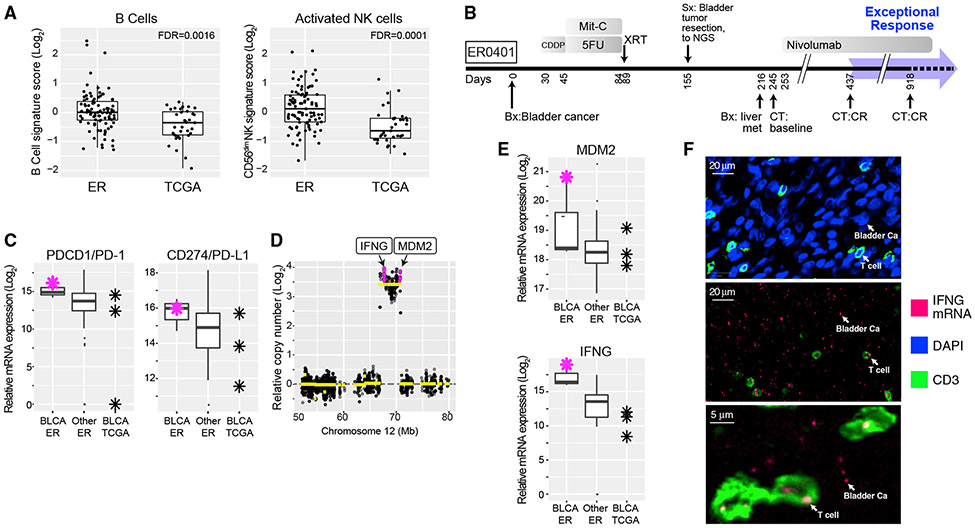
Figure 4. Immune Microenvironment of Exceptional Responders.
(A) Comparison of B cell- and CD56dim cell-type-specific expression scores between ER (n = 93) and TCGA (n = 35) cases. The box marks the 25th and 75th quartiles and the whiskers are 1.5 times the inter-quartile range. See also Figure S5 and Table S3.
(B) Treatment timeline for ER0401 with metastatic bladder carcinoma. p values represent FDR-adjusted t test.
(C) Relative mRNA expression of PDCD1, encoding PD-1, and CD274, encoding PD-L1, in bladder cancer from ER (n = 3), other ER cancers (n = 111), and BLCA from TCGA (n = 3). Red asterisk is ER0401; the box is defined as in (A). CDDP, cisplatin; Mit-C, mitomycin C.
(D) DNA copy number at the MDM2 locus in ER0401 showing high-level amplification of IFNG, encoding interferon-γ.
(E) Relative mRNA expression levels of IFNG and MDM2. This case expresses a higher level of IFNG mRNA than any other ER case. n, number of cases; the box is as in (A).
(F) In situ analysis of IFNG mRNA expression in top panel, CD3 immunofluorescence (green) labeling T cells. DAPI labeling (blue) of cell nuclei, most of which are tumor cells. Middle panel, IFNG mRNA detected by in situ hybridization using a fluorescently labeled IFNG probe (red), with anti-CD3 co-staining (green). Most IFNG mRNA foci were detected in the malignant bladder cancer (Ca) cells but were also present in T cells, as indicated. The tissue section was DNase treated to abrogate hybridization due to amplified IFNG DNA. Bottom panel, high-power image showing IFNG mRNA foci as indicated.

