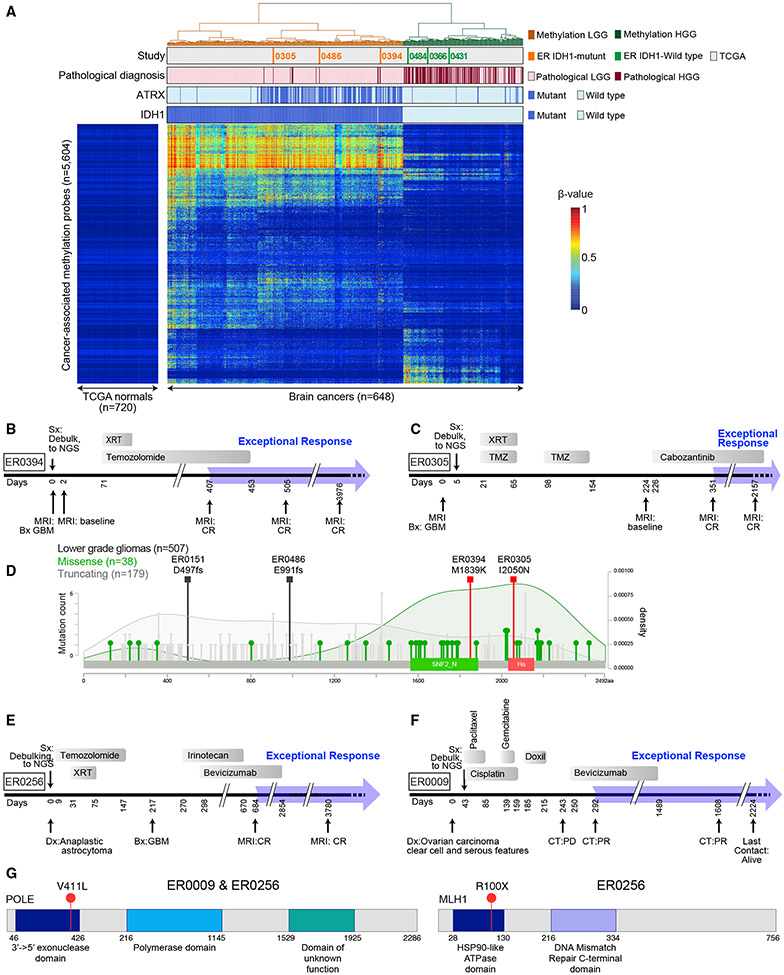
Figure 5. Mutations in ER GBM Cases Prognostic for Favorable Outcome.
(A) IDH1 mutation correlates with DNA methylation pattern in LGG and GBM. A heatmap showing unsupervised clustering of cancer-associated DNA hypermethylation profiles of brain tumors from ER (n = 6), TCGA LGG (n = 511), and TCGA GBM (n = 131) cases as indicated in tracks above the heatmap. The DNA methylation β values are represented by using a color scale from dark blue (low DNA methylation) to red (high DNA methylation). Four ER cases (ER0072, ER0151, ER0187, and ER0256) were excluded from this analysis, as described in the STAR Methods (see “Joint unsupervised clustering of ER and TCGA brain tumors”). See also Figure S6 and Table S5.
(B) Treatment timeline for case ER0394.
(C) Treatment timeline for ER case ER0305.
(D) Missense mutations in ATRX in ER0305 and ER0394 are likely to be functional. The distribution of missense (green lollipops) and truncating mutations (gray lollipops) in gliomas are shown. The two missense mutations found in the ER gliomas (orange squares), M1839K and I2050N, are in key functional domains of the proteins, SNF2_N and Helicase (He), respectively. SNF2_N domain, amino acid positions 1,536–1,889; helicase domain, amino acid positions 2,018–2,155. Darker green shading depicts the density of missense mutations; light gray shading is the distribution of truncating mutations. The increase in missense mutation density over the SNF2 and helicase domains suggests that these mutations may be enriched for functional mutations in glioma. (Compare to distributions of missense and truncating mutations in lung adenocarcinoma from the TCGA Pan Lung Cancer, where ATRX plays a much smaller role and inactivating mutations are rare, see Figure S6B.)
(E) Treatment timeline for case ER0256.
(F) Treatment timeline for case ER0009. Doxil, doxorubicin, liposomal.
(G) Schematic depiction of POLE (left) and MLH1 (right) genes accounting for the ultramutated phenotype in cases ER0256 and ER0009.

