Figure.
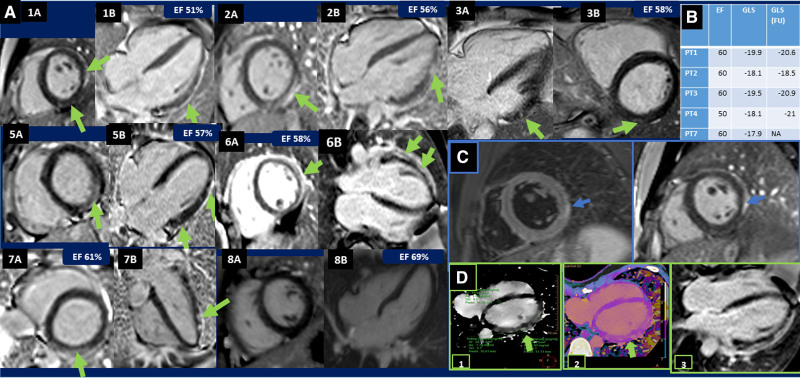
Echocardiography, magnetic resonance imaging (MRI), and cardiac computed tomography (CT) findings. A, Late gadolinium enhancement (LGE) short-axis and 4-chamber images that demonstrate both linear (1A, 2A, 5A, 6A, 6B, and 7A) and patchy (1A, 1B, 2B, 3A, 3B, 5B, 6B, and 7B) subepicardial and midmyocardial LGE patterns. B, Table showing patients with reduced global longitudinal strain (GLS), their ejection fraction (EF) and GLS measured at a follow-up (FU) visit a median of 18 wk after their hospitalization. C, Patient no. 1, cardiac MRI, oblique short-axis views. Left: T2W dark blood (turbo inversion recovery magnitude) image showing high signal intensity corresponding to edema in the lateral wall. Right: subepicardial LGE in the lateral wall. D, Showing both MRI and cardiac CT, 4-chamber view of patient no. 6 (1+2)-delayed enhancement 7 min postinjection using prospective electrocardiography-triggered axial scans set at middiastolic phase (78%) using detector-based spectral CT (Spectral CT 7500, Philips Healthcare, Best, the Netherlands). 1: Iodine density image. 2: conventional overlay Z-effective, showing patchy midepicardial and subepicardial delayed iodine enhancement of the lateral wall. 3: Cardiac MR showing patchy midepicardial and subepicardial LGE of the lateral wall.

