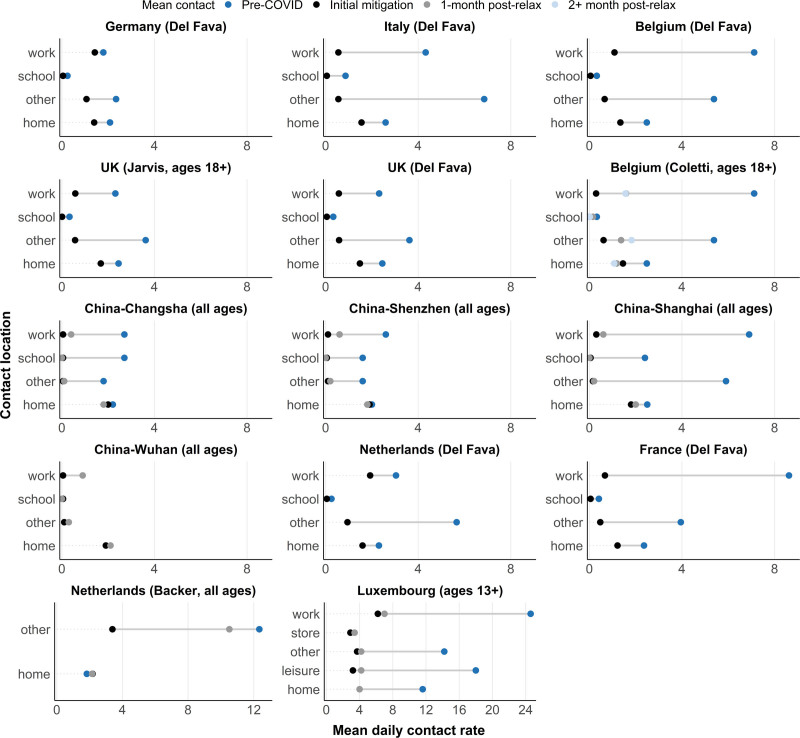
FIGURE 3.
Changes in contact rates pre-COVID (dark blue), during initial mitigation measures in spring 2020 (black), 1-month post first relaxation of mitigation measures (gray) and 2+ months post first relaxation (light blue). stratified by contact location. Estimates during COVID-19 were extracted from studies, estimates pre-COVID were either extracted from studies or from SOCRATES.24 No pre-COVID data stratified by contact location was available for Wuhan. X-axis limits for Netherlands (Backer) and Luxembourg were increased to capture larger pre-COVID contact rates. COVID-19 indicates coronavirus disease 2019.

