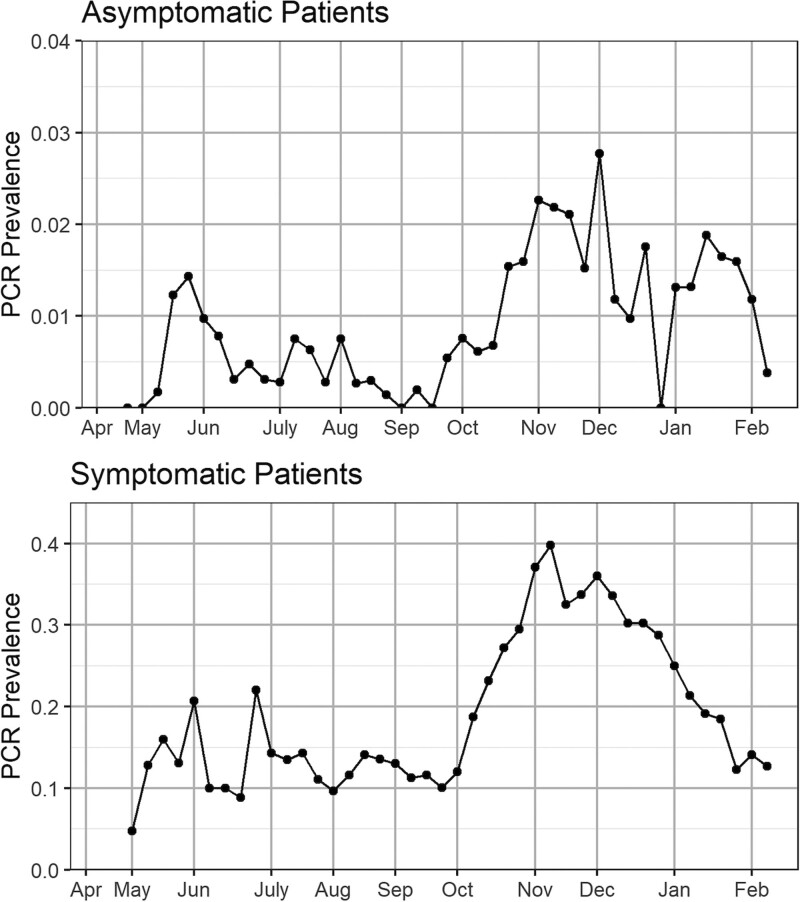
FIGURE 1.
Observed weekly PCR test incidence for asymptomatic and symptomatic patients in the Community Hospital system. Note the different scales on the two graphs. The positions of the months on the x axis correspond to the week of data containing the first of that month. PCR indicates polymerase chain reaction.

