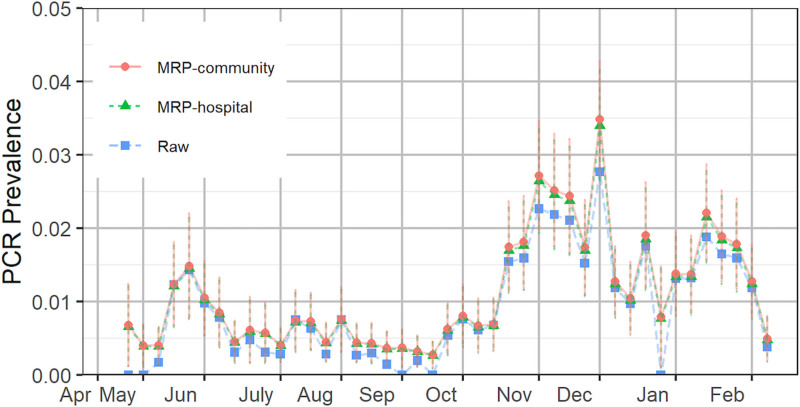
FIGURE 2.
Estimated prevalence of the hospital system and community based on asymptomatic patients. The error bars represent one standard deviation of uncertainty. The positions of the months on the x axis correspond to the week of data containing the first of that month. MRP indicates multilevel regression and poststratification; PCR, polymerase chain reaction.

