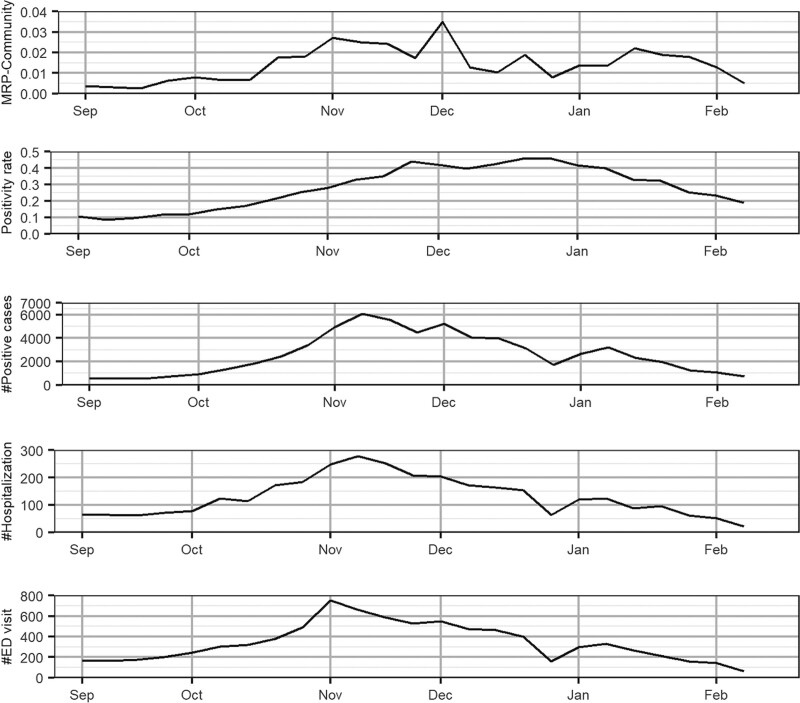
FIGURE 3.
Comparison of MRP-normalized estimates based on asymptomatic cases (MRP community) with reported hospitalization counts, ED visits, positivity rate, and the number of positive cases in Lake and Porter counties. The vertical dashed lines indicate the peak values. Note the different scales on the five graphs. The positions of the months on the x axis correspond to the week of data containing the first of that month. ED indicates emergency department; MRP, multilevel regression and poststratification.

