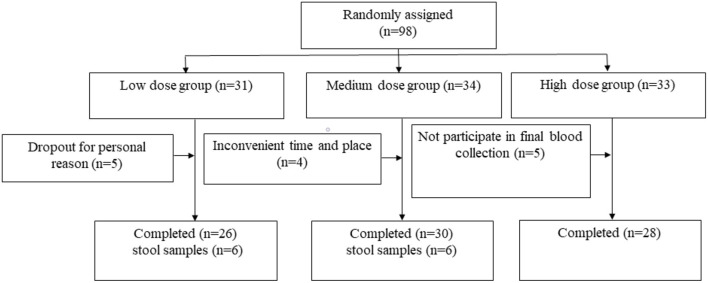
Figure 1.
Flow diagram of participant progress through the study. 1means nine participants provided samples before the intervention, three participants lose after the intervention, six participants from the Low group provided samples both before and after the intervention finally. 2means seven participants provided samples before the intervention, one participant lose after the intervention, six from the Medium group provided samples both before and after the intervention finally. 3means five participants provided samples before the intervention, all participants lose after the intervention, there are no complete samples finally in the High group.

