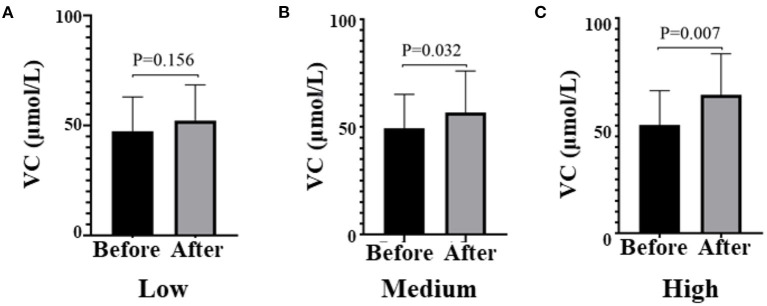
Figure 2.
Plasma VC levels before and after the intervention in all three groups, respectively. (A) means Low dose group, (B) means Medium dose group, (C) means High dose group. Black means VC plasma concentration (μmol/l) before the intervention, gray means VC plasma concentration after the intervention; paired t-test used to test the difference before and after the intervention in three groups. VC, vitamin C.

