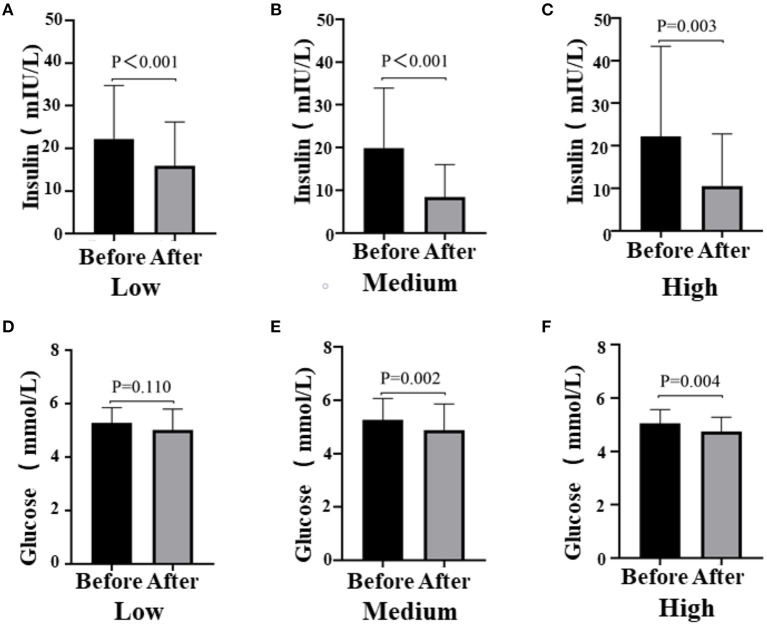
Figure 3.
Fasting blood glucose levels (A, Low dose group; B, Medium dose group; C, High dose group) and insulin levels (D, Low dose group; E, Medium dose group; F, High dose group) before and after the intervention in all three groups, respectively. Black means glucose or insulin plasma concentration (mmol/l, mIU/l) before the intervention, gray means glucose or insulin plasma concentration after the intervention; paired t-test used to test the difference before and after the intervention in the three groups.

