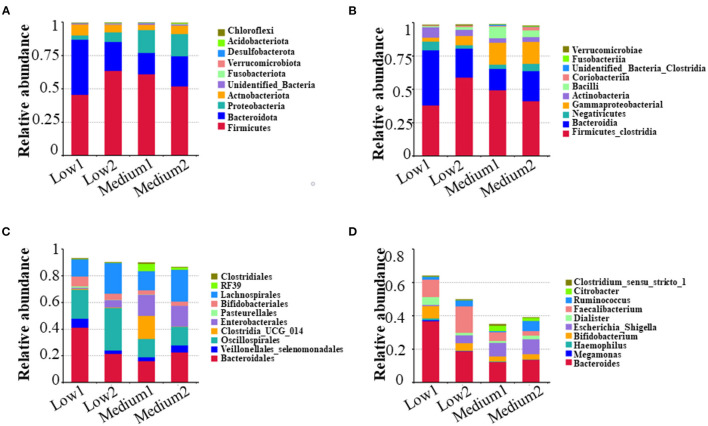
Figure 6.
Analysis and comparison of relative abundance of top 10 before and after the intervention in the Low and the Medium groups at phylum, class, order, and genus level. The higher the relative proportion, the more abundance in the community at different biological classification level. (A) means phylum level; (B) means class level; (C) means order level; and (D) means genus level.

