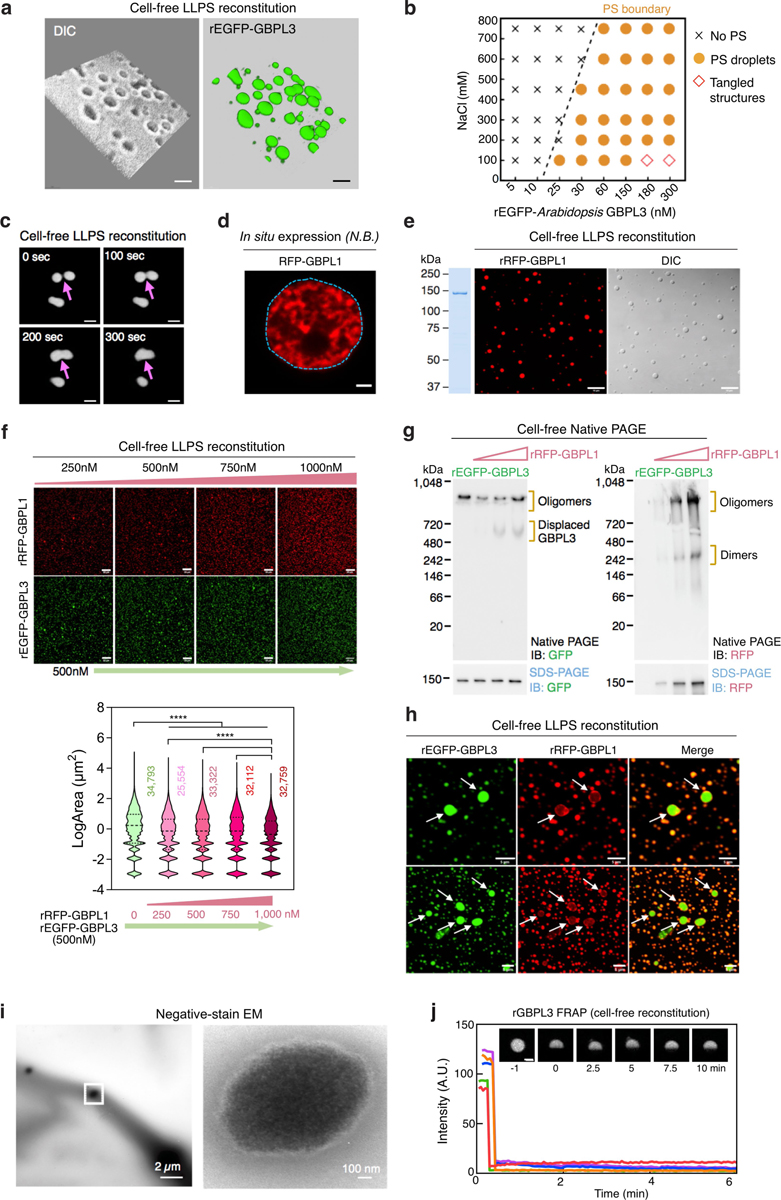
Extended Data Fig. 6 |. Comparative LLPS behaviour of GBPLs in cells and cell-free systems.

a, A 3D volume view of rEGFP–GBPL3 droplets (10% Ficoll) depicted in (Fig. 3d). Bar, 2 μm. b, Phase separation (PS) diagram of rEGFP–GBPL3 across NaCl concentrations 30 min after reconstitution. c, Confocal images showing GBPL3 condensates fusion behaviours every 100 s in vitro. Images collected 30 min after reconstitution in droplet buffer (20 mM HEPES [pH 7.5], 200 mM NaCl, 1 mM TCEP, 10% Ficoll). Bar, 5 μm. d, RFP-GBPL1 does not generate LLPS nuclear condensates in situ in N. benthamiana. e, in vitro phase separation of rRFP–GBPL1 (375 nM) in droplet buffer (20 mM HEPES [pH 7.5], 150 mM NaCl, 1 mM TCEP). Coomassie brilliant blue (CBB) of rRFP–GBPL1 is shown on the left. Bar, 10 μm. f, Co-condensation assay of rEGFP–GBPL3 and rRFP–GBPL1 in vitro. Below, quantification of EGFP–GBPL3 droplet size. Median (solid line) and quartile (dashed line) values. Comparison of mean via one-way ANOVA with Holm–Sidak post hoc test (****P < 1.0 × 10⁻¹⁵, n = number of biologically independent droplets). g, Native PAGE of rEGFP−GBPL3 in the presence of increasing concentrations of rRFP−GBPL1 leads to GBPL3 displacement. Same loading controls below the original (anti-GFP) and reprobed (anti-RFP) native gel separated by SDS–PAGE. h, Exclusion of rRFP−GBPL1 from larger rEGFP−GBPL3 droplets in co-condensation assays. i, Representative negative stain EM images of rGBPL3 droplets at 24 h. Bar, 2 μm. Inset at right. Bar, 100 nm. j, FRAP analysis of 2 h old rEGFP−GBPL3 droplets in vitro. Bar, 5 μm. Fluorescence recovery of 5 individual droplets shown. Insert, representative images of a bleached droplet over 10 min recovery.
