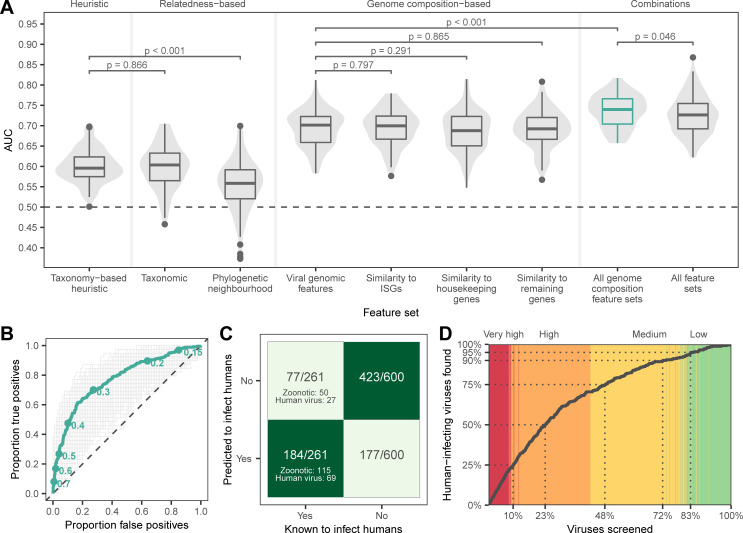
Fig 1. Machine learning prediction of human infectivity from viral genomes.
(A) Violins and boxplots show the distribution of AUC scores across 100 replicate test sets. (B) Receiver operating characteristic curves showing the performance of the model trained on all genome composition feature sets across 1,000 iterations (gray) and performance of the bagged model derived from the top 10% of iterations (green). Points indicate discrete probability cutoffs for categorizing viruses as human infecting. (C and D) show binary predictions and discrete zoonotic potential categories from the bagged model, using the cutoff that balanced sensitivity and specificity (0.293). (C) Heatmap showing the proportion of predicted viruses in each category. (D) Cumulative discovery of human-infecting species when viruses are prioritized for downstream confirmation in the order suggested by the bagged model. Dotted lines highlight the proportion of all viruses in the training and evaluation data that need to be screened to detect a given proportion of known human-infecting viruses. Background color highlights the assigned zoonotic potential categories of individual viruses encountered (red: very high, orange: high, yellow: medium, and green: low). Numerical data underlying this figure can be found at https://github.com/nardus/zoonotic_rank/tree/main/FigureData (doi: 10.5281/zenodo.4271479). AUC, area under the receiver operating characteristic curve.

