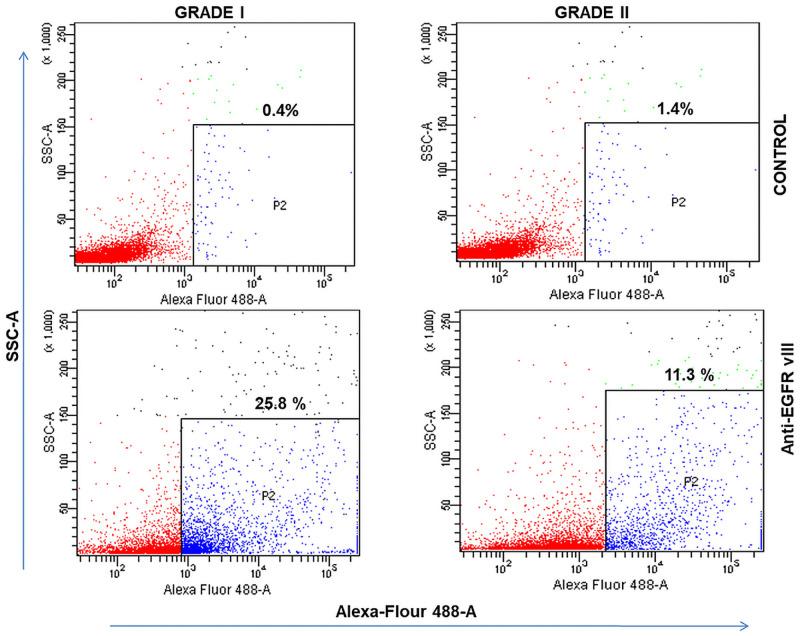
Fig 5. Generation of EGFRvIII− and EGFRvIII+ sublines as determined via FACS.
MG Grade I representing 25.8% EGFRvIII (Alexa flour 488) positive cells (SSC vs Alexa Flour 488) while Grade II representing 11.1% EGFRvIII (Alexa flour 488) positive cells (SSC vs Alexa Flour 488). There is about 2 folds decrease in EGFR V3+ cells in grade II as compared to grade I. Unlabelled cells were used as controls in both grade I and grade II.

