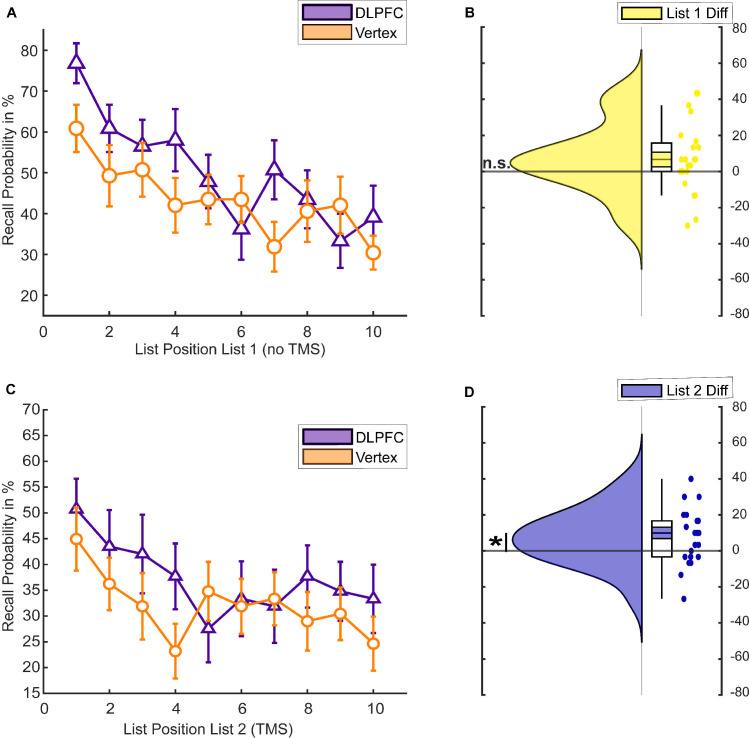
Fig 5. Behavioural memory performance in experiment 2.
(A) Serial position curve for List 1 (N = 23). (B) Raincloud plots of memory performance for List 1 words (difference between DLPFC and vertex stimulation). Coloured area within the box plots indicate the standard error, while the circles depict individual data points. (C) Serial position curve for List 2. (D) Raincloud plots of memory performance for List 2 words (difference between DLPFC and vertex stimulation). The data and scripts used to generate this figure can be found at https://osf.io/dyxjv/. DLPFC, dorsolateral prefrontal cortex; TMS, transcranial magnetic stimulation.

