
Fig. 3.
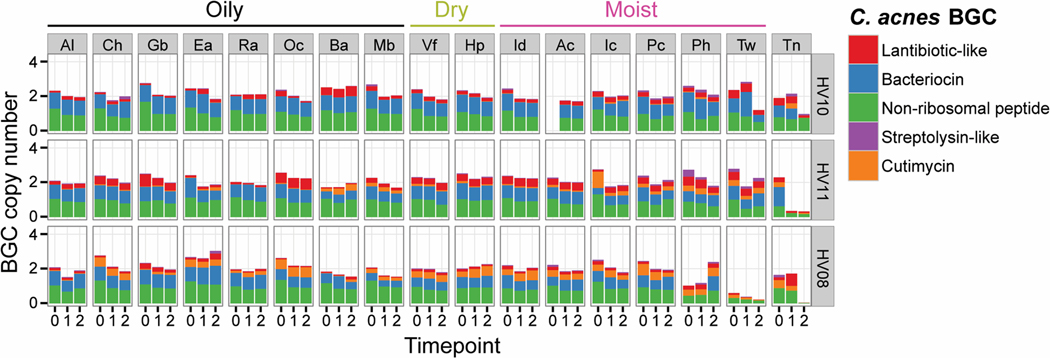
Example of spatial and temporal distribution of C. acnes BGCs in the skin metagenomes of three healthy individuals with low, medium or high relative abundance of the cutimycin BGC across 17 skin sites. Rows group samples from a single volunteer (coded Healthy Volunteer (HV) 01–12), columns represent samples across a specific body site (coded Ac through Vf). Cells contain bar graphs for each of the three time points, depicting the copy number of the C. acnes BGCs, which are standardized by comparing against 13 C. acnes housekeeping genes. The BGC types, bacteriocin, lantibiotic, non-ribosomal peptide, streptolysin-like peptide and cutimycin are color coded and their abundances are stacked on top of each other (a colored bar with a height of 1 means all of the C. acnes in the sample harbor that BGC, whereas a height of 0 means the BGC is absent in all of the C. acnes). Al = alar crease, Ch = cheek, Gb = glabella, Ea = external auditory canal, Ra = retroauricular crease, Oc = occiput, Ba = back, Mb = manubrium, Vf = volar forearm, Hp = hypothenar palm, Id = interdigital web space, Ac = antecubital fossa, Ic = inguinal crease, Pc = popliteal fossa, Ph = plantar heel, Tw = toe web space, Tn = toenail (see also diagram in Fig. S17A).