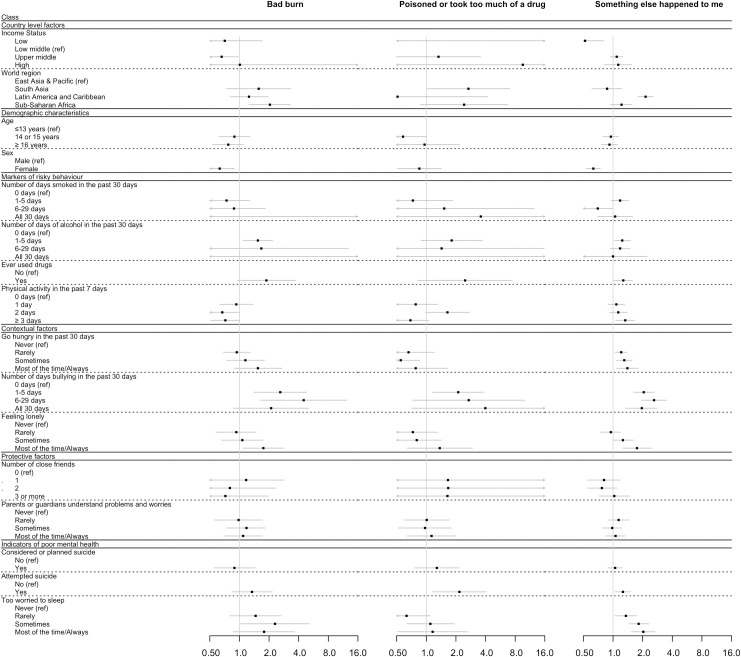
Fig 3. Forest plot showing the multivariable association (as odds ratio [OR] and 95% confidence interval [95% CI]) between serious injury type (bad burn, poisoned or took too much of a drug, and something else happened) and markers of psychosocial circumstances, adjusting for country-level factors and demographic characteristics, but not for aggressive behaviour indicators.
Adjustment for non-response rate of participants was done as described in Methods. p-Values can be found in Table 5.

