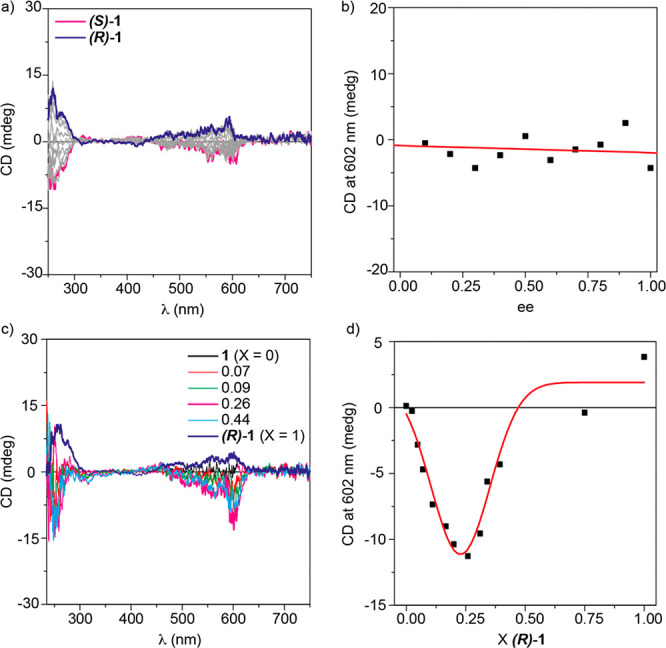
Figure 6.

Amplification-of-asymmetry experiments performed with N-annulated PBIs 1. (a) ECD spectra for MR experiments. (b) Changes in ECD intensity at 602 nm as a function of the ee upon adding (R)-1 to a solution of (S)-1. (c) Selected ECD spectra registered for the SaS experiments performed by mixing 1 and (R)-1. (d) Changes in the ECD intensity at 602 nm upon increasing the molar fraction (X) of the chiral sergeant (R)-1. The red line in (d) corresponds to a Gaussian fit to guide the eye. Experimental conditions: MCH, cT = 50 μM, 20 °C.
