
Figure 1.
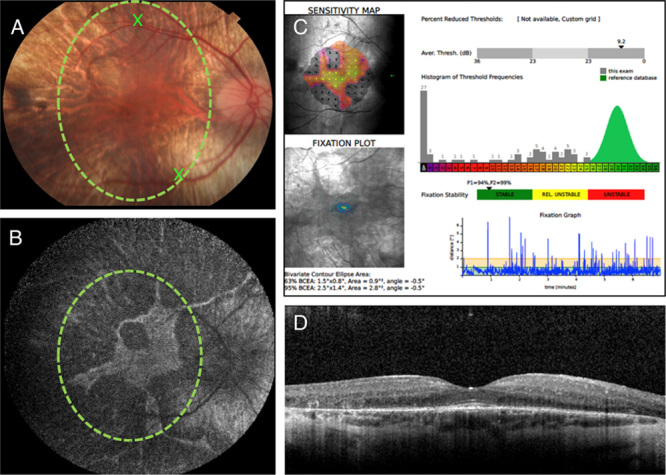
A, A 30-degree color photograph of the right eye of a 25-year-old male with genetically proven choroideremia. The green circle shows treatment target zone based on the preserved RPE areas seen on the fundus autofluorescence shown in (B). The 2 Xs indicate 2 potential injection sites located near the retinal vascular landmarks, at least 3 mm away from the fovea. B, A 55-degree fundus autofluorescence image showing hyperfluorescent area of preserved RPE and retina. The green circle shows the treatment target zone, which was mapped to the fundus color photo shown in (A), using vascular landmarks. C, Microperimetry image showing fundus sensitivity map, fixation plot, the average threshold value (dB), and fixation stability plot. D, Optical coherence tomography through the fovea shows thin outer retinal layer with retinal tubulation temporally, preserved subfoveal outer retinal layers and retinal pigment epithelium, and thin choroid.