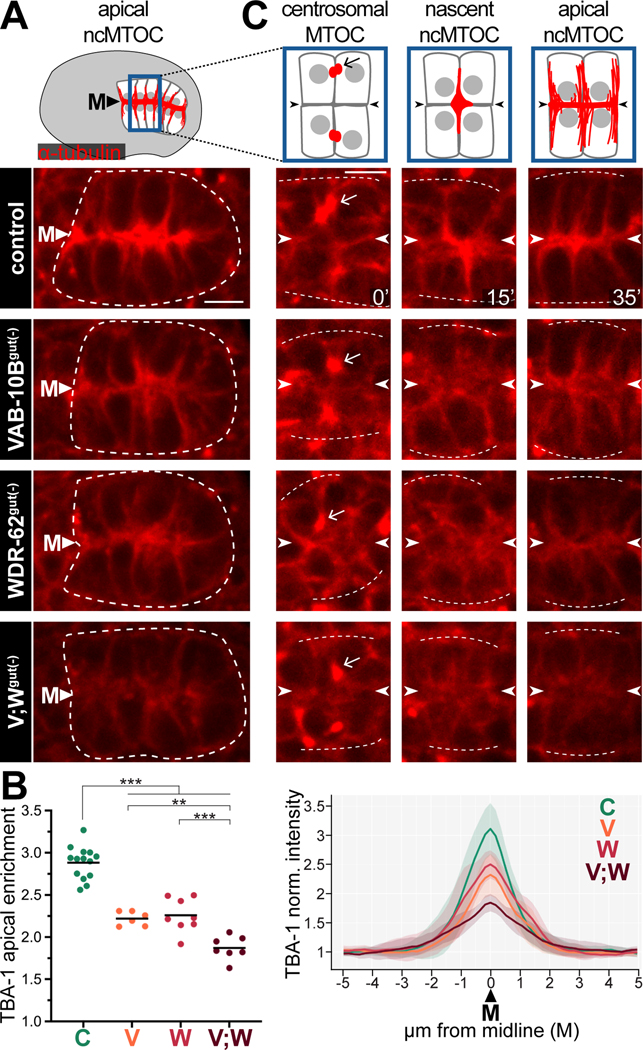
Figure 3. VAB-10B and WDR-62 are required for non-centrosomal microtubule organization.
(A) Dorsal view of polarized intestine (white dotted line) from live imaging of mCherry::TBA-1/α-tubulin in control, VAB-10Bgut(−), WDR-62gut(−), or [VAB-10B; WDR-62]gut(−) (V;Wgut(−)) embryo. Cartoon of embryonic intestine (top) represents microtubules (red), nuclei (gray), midline (‘M’) in control embryos. (B) Quantifications of mCherry::TBA-1 in polarized intestines as in (A). Left: Apical enrichment of mCherry::TBA-1. Each dot represents a single embryonic intestine and horizontal black lines indicate mean value; **p < 0.01, ***p < 0.001. Right: Normalized mCherry::TBA-1 fluorescence signal along a line perpendicular to the midline of anterior intestine; lighter shading indicates standard deviation. For both graphs: control (‘C’) n = 15; VAB-10Bgut(−) (‘V’) n = 8; WDR-62gut(−) (‘W’) n = 9; V;Wgut(−) (‘V;W’) n = 8. (C) Live imaging of mCherry:TBA-1 in cells exiting E8-E16 division (t = 0’), polarizing E16 cells (t = 15’), and newly polarized E16 cells (t = 35’). Arrow points to presumptive centrosomes and arrowheads indicate future apical surface. White dotted lines mark approximation of intestinal edge. Scale bars = 5 μm.
See also Figures S1-S3, S5, and S6.

