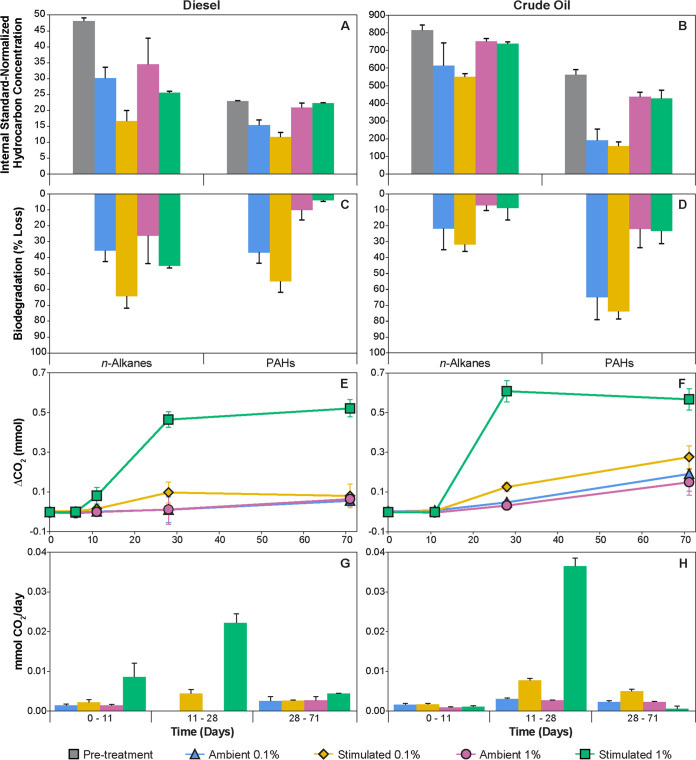
FIG 2.
Hydrocarbon biodegradation within 0.1 and 1% (vol/vol) diesel (A, C, E, and G)- and crude oil (B, D, F, and H)-amended microcosms with nutrient stimulation or without (ambient). (A and B) Concentration of hydrocarbon compound groups at day 0 (pre-treatment) and after 71 days of incubation at 4°C. Hydrocarbon concentrations in diesel were obtained by normalizing compound peak areas against 1,3+3,9+2,10+3,10-dimethylphenanthrene, and in crude oil by normalizing against 17α(H),21β(H)-hopane. (C and D) Biodegradation conveyed as losses of measured n-alkanes (C12-C25) and PAHs from pre-treatment levels. (E to H) CO2 production (E and F) determined by GC is plotted as the difference between hydrocarbon-amended and -unamended microcosms and was used to estimate rates of CO2 production associated with hydrocarbon biodegradation (G and H) (CO2 concentrations for unamended controls are shown in Fig. S1). Error bars represent standard errors of triplicate microcosms of the same treatment.

