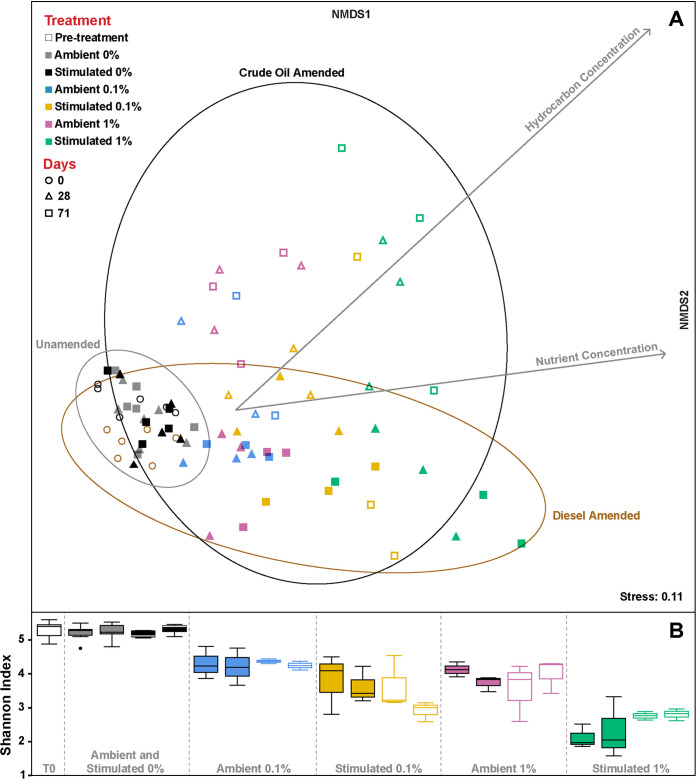
FIG 3.
(A) Microbial community structure similarity among unamended (black and gray points), diesel-amended (solid-color points) and crude oil-amended (unfilled colored points) Labrador sediment microcosms incubated at 4°C for 71 days visualized by nonmetric multidimensional scaling (NMDS) of Bray-Curtis values for each community using 0.95 confidence cutoffs (ellipses). The lengths of the two factor arrows indicate the contribution of hydrocarbon and nutrient concentration variables to the dissimilarity between treatment group microbial communities. Significant fit and strong correlation were observed with hydrocarbon concentration (r2 = 0.45, P = 0.001), nutrient concentration (r2 = 0.34, P = 0.001), and type of petroleum product (r2 = 0.57, P = 0.001). The stress value corresponds to disagreement between the two-dimensional configuration and predicted values, with stress <0.2 considered a good representation. Triplicates are plotted for all conditions except for crude oil treatment “Ambient 0.1%,” for which one replicate was lost. Twelve microcosms were assessed to obtain day 0 (pre-treatment) microbial community data. Associated ANOSIM statistics and simper results are presented in Data Set S2. (B) Shannon Index (i.e., α-diversity) for each treatment group, with the central band representing the median among replicates, the box containing 50% of observations, and whiskers extending to the lowest and highest values excluding outliers (separate points). Aside from the pre-treatment box all treatments have two pairs, the first being the day 28 results, and the second being that of day 71.

