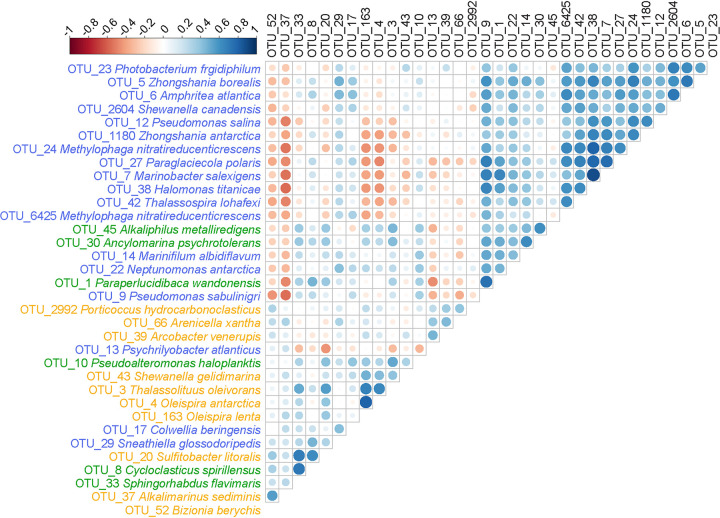
FIG 5.
Spearman correlation matrix highlighting positive (blue) or negative (red) cooccurrence relationships between hydrocarbon associated OTUs (cross-reference with Data Set S4). Analysis utilized rarefied sequences from all incubations, both amended and unamended, at 0, 28, and 71 days of incubation. Empty boxes indicate no correlation was found between pairs, while the larger the circle size and darker the color, the stronger the correlation between associated OTUs. The highlighting of the OTUs indicates they were significant indicators of crude oil (blue), diesel (yellow), and both crude oil and diesel (green) enrichment.

