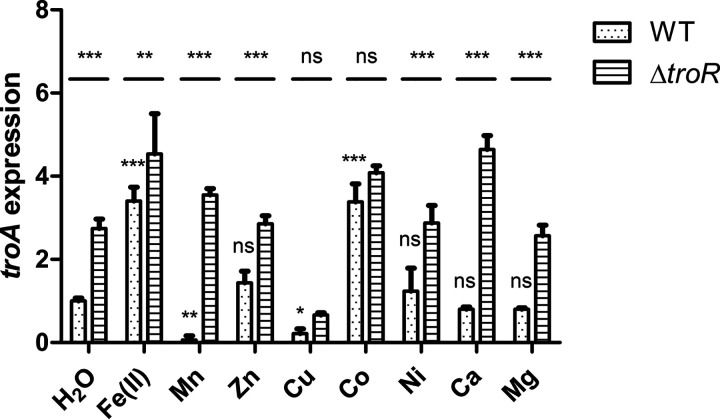
FIG 7.
troA expression in the WT and ΔtroR strains in response to various metals. The WT and ΔtroR strains were grown in TSBS to an OD600 of 0.6 and treated for 15 min with 2 mM Fe(II), 2 mM Mn, 50 μM Zn, 1 mM Cu, 1 mM Co, 1 mM Ni, 2 mM Ca, 2 mM Mg, or deionized water. RNA was isolated to perform reverse transcription-quantitative PCR analysis. The data shown are the means ± SDs from three biological triplicates. troA expression in the WT strain in response to the metals was analyzed by one-way analysis of variance with Bonferroni’s posttest. Two-way analysis of variance with Bonferroni’s posttest was used for comparison of troA expression in the ΔtroR mutant with that in the WT strain. *, P < 0.05; **, P < 0.01; ***, P < 0.001; ns, no significant difference.

