FIG 3.

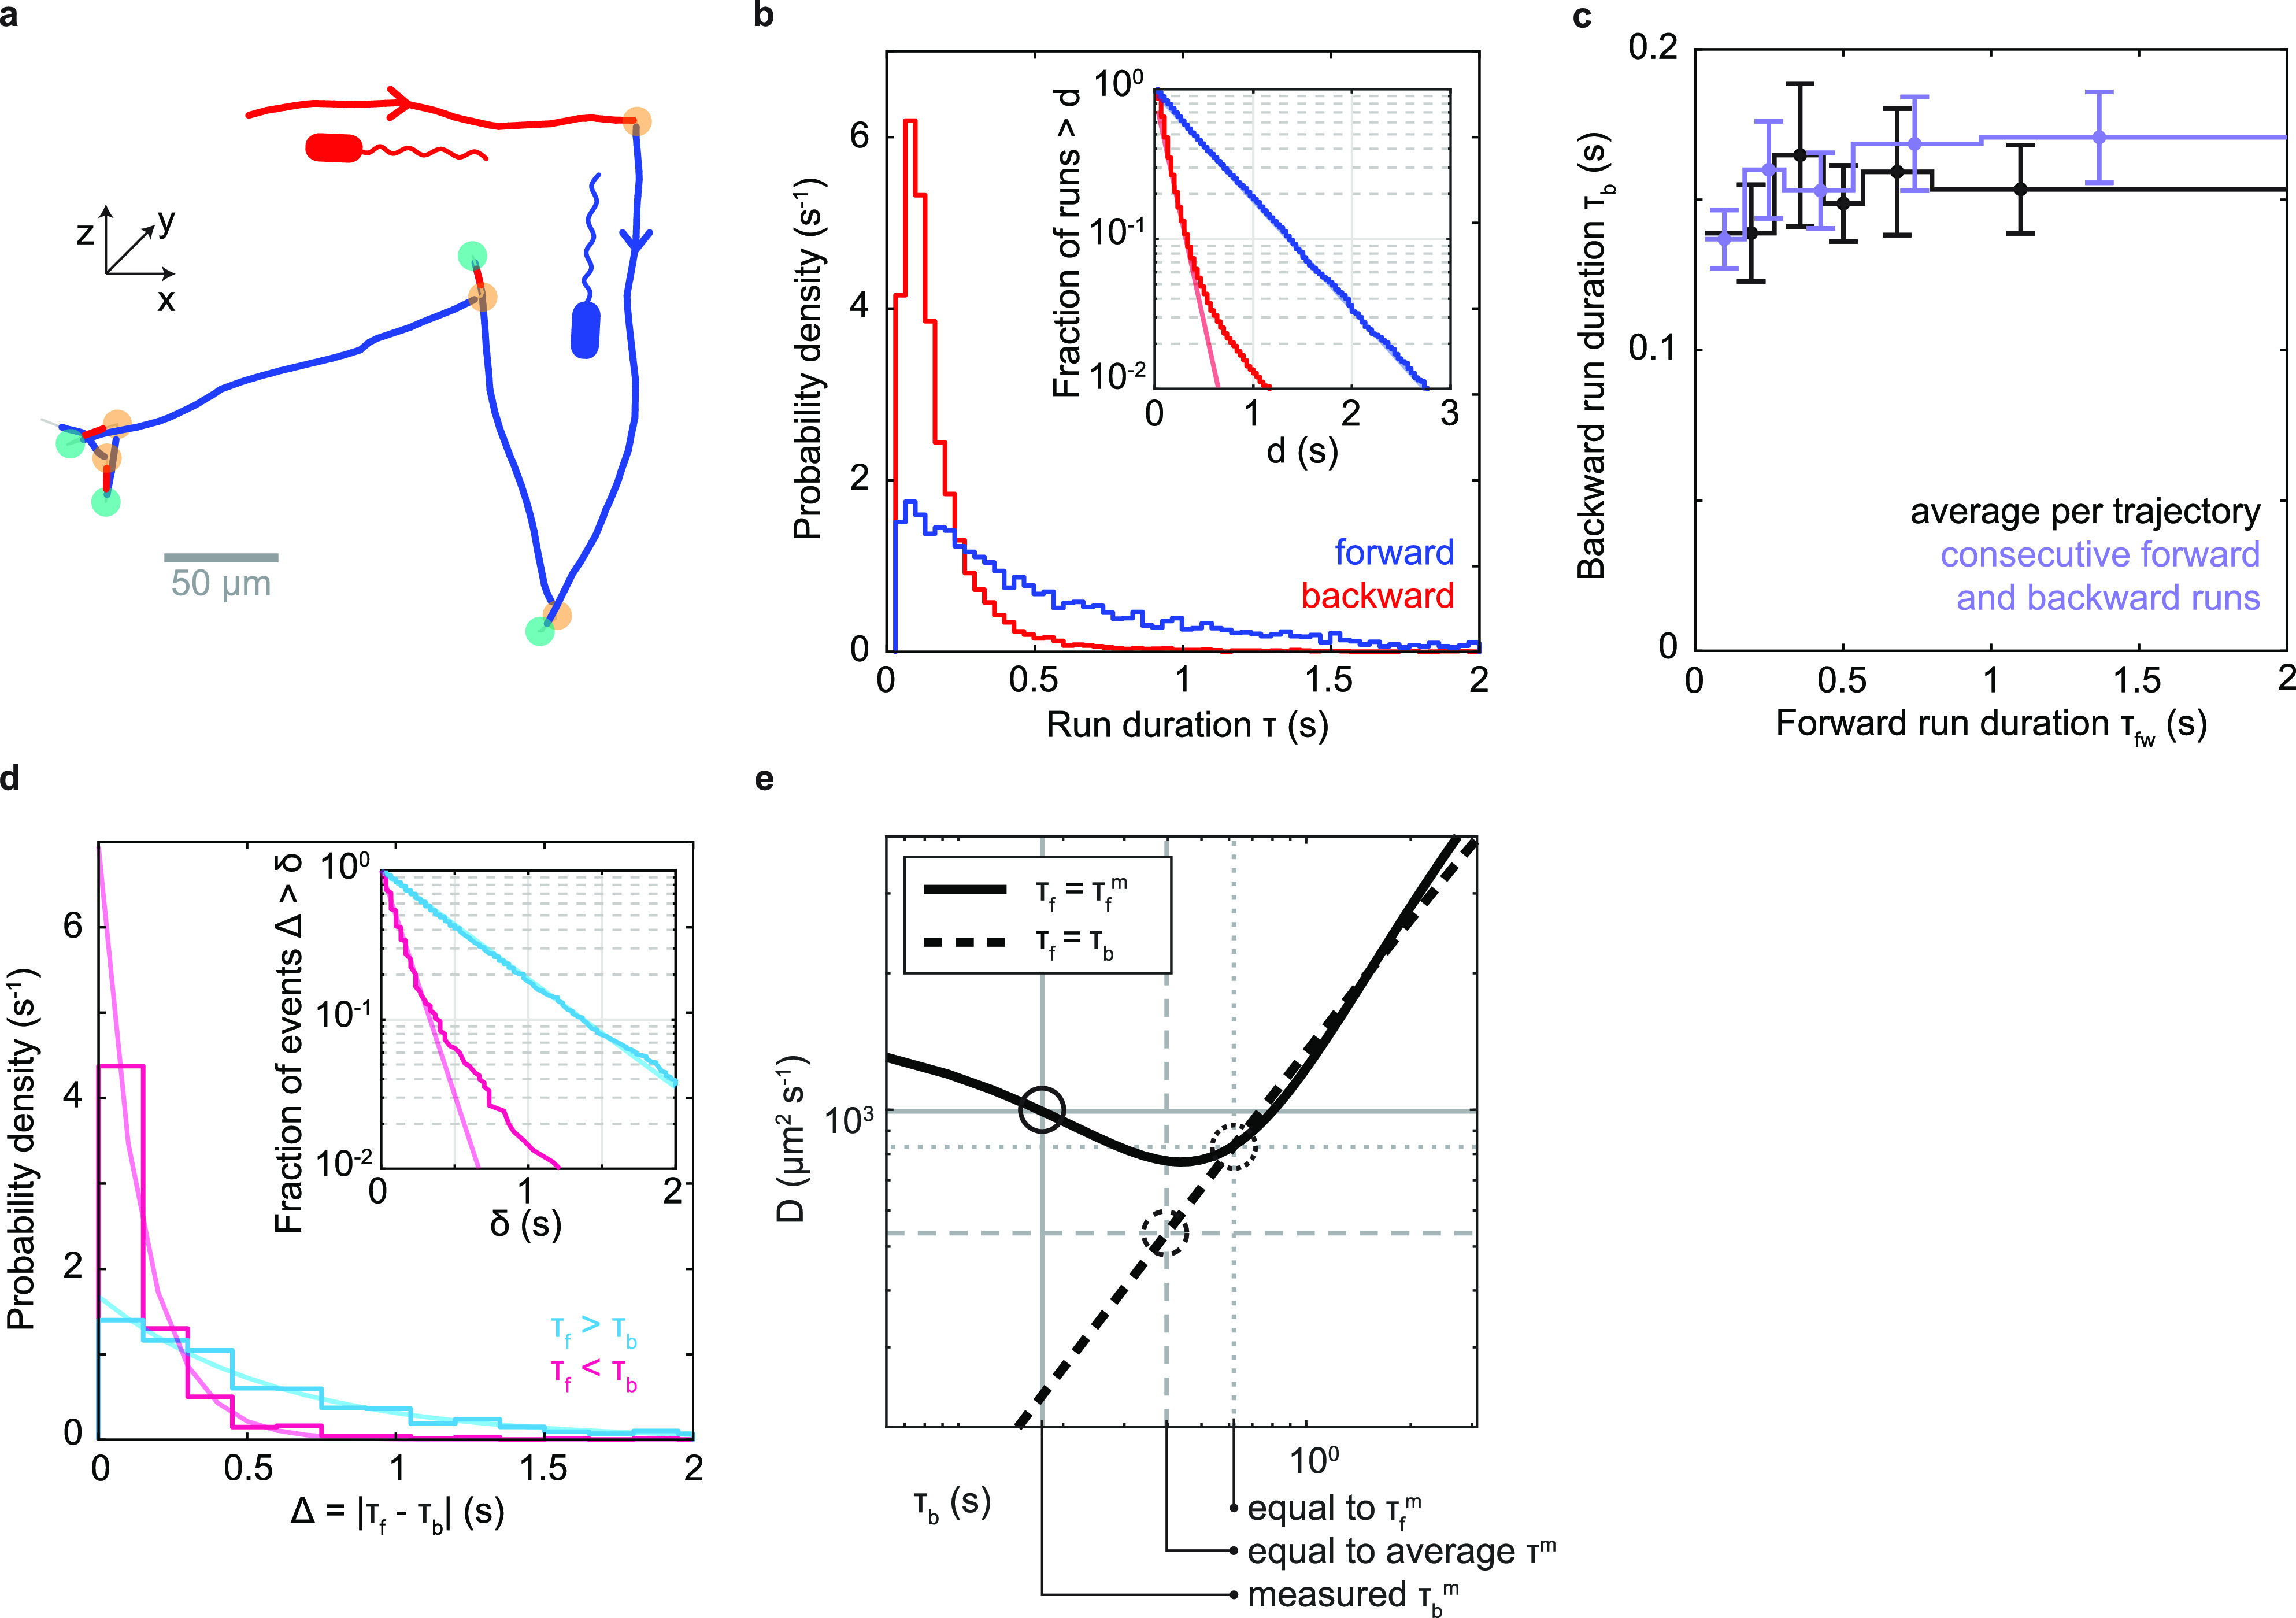
Run characterization. (a) Example trajectory from Fig. 1c with runs identified as forward (blue) or backward (red) based on the identity of the bordering turning events (orange, flicks; teal, reversals). (b) Run duration distributions. Average durations of backward (red) and forward (blue) runs are 0.174 ± 0.002 s (mean ± SE) and 0.62 ± 0.01 s, respectively. (Inset) Fraction of runs that are longer than a threshold, d, as a function of d. Line fits in log-linear space to the ranges of 0.1 to 1.5 s and 0.067 to 0.4 s yield exponential decay time scales of 0.60 s and 0.14 s for forward and backward runs, respectively. The tail of the backward run duration distribution likely represents misidentified forward runs. (c) Relationship between backward and forward run duration. Purple, average duration of backward runs as a function of the preceding forward run’s duration; black, average duration of backward runs as a function of average duration of forward runs for trajectories containing at least 4 runs of known orientation. (d) Distribution of the absolute differences in duration between a forward run and the subsequent backward run, shown in cyan (magenta) when the forward run is longer (shorter) than the backward. (Inset) Fraction of events that are longer than a threshold, x, as a function of x. Partially transparent lines indicate exponential decay fits. For positive differences (cyan), a maximum likelihood fit of an exponential distribution yields an exponential decay time of 0.60 s. For negative differences (magenta), the slope of a line fit in semilog space in the range of 0 to 0.8 s yields a decay time of 0.14 s. We attribute the tail of the distribution for negative differences to misidentified forward runs, as in panel b. (e) Predicted effective diffusion coefficient for run-reverse-flick motility as a function of the average backward run duration, τb, based on results of Taktikos et al. (26) (see Note S1 for details). The black solid line indicates a fixed forward run duration equal to the measured value, τf = τfm = 0.62 s, and the black dashed line indicates equal forward and backward run durations. Gray dashed lines mark a scenario where both forward and backward run durations are equal to the average measured run duration. Gray dotted lines mark the scenario where both equal the measured forward run duration. Gray solid lines indicate the measured scenario of τfm = 0.62 s and τbm = 0.174 s.
