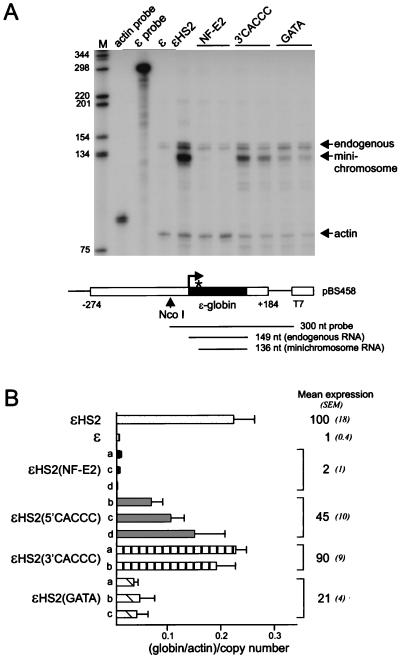
FIG. 4.
Transcription of the ɛ-globin gene linked to HS2 mutants. (A) RNase protection was used to measure the abundance of ɛ-globin transcripts. The episomal copy of the ɛ-globin gene has been marked by a mutation in the 5′ untranslated region (∗) and produces a shorter protected fragment than endogenous transcripts (shown at the bottom). The bands produced by the endogenous and minichromosomal copies of the ɛ-globin gene are indicated by arrows. An RNA probe for γ-actin was included as a loading control. Lane M, markers in base pairs as indicated at the left. (B) Mean levels of expression of ɛ-globin RNA and SEM for several individual clones with each type of HS2 mutation are shown at the right. The amount of ɛ-globin RNA was determined for three separate RNA preparations for each clone. The results are compared with the mean levels of expression of ɛ-globin RNA for wild-type ɛ clones (n = 3) and wild-type ɛHS2 clones (n = 12). The differences from the wild-type grand mean were statistically significant (P < 0.05) except for the HS2 3′ CACCC mutant.

