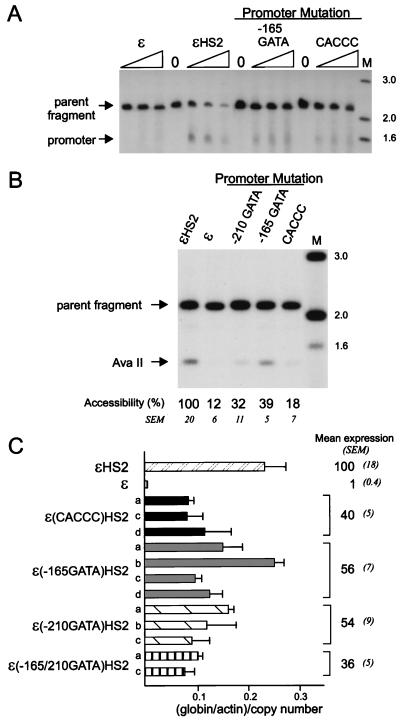
FIG. 6.
Effects of promoter mutations on nuclease sensitivity and transcription of the ɛ-globin promoter. (A) Samples were digested with DNase I and processed as detailed in the legend to Fig. 3A, mapping the ɛ-globin promoter HS site after digestion with BglII. (B) Samples were digested with AvaII and processed as detailed in the legend to Fig. 3B. The mean percent cutting and SEM for the mutant clones compared to wild-type levels are shown below each lane and differed significantly from the wild-type level (P < 0.05) for all mutants. For the positions of DNase I and AvaII cleavage within the ɛ-globin promoter, see Fig. 3C. Lanes M in panel A and B, markers with sizes given in kilobases at the right. The probe fragment used in panels A and B was as detailed in the legend to Fig. 2A. (C) Mean levels of expression of ɛ-globin RNA and SEM for several individual clones with each type of promoter mutation. The relative amount of ɛ-globin RNA was determined as detailed in Materials and Methods and in the legend to Fig. 4C. The differences from the wild-type grand mean were all statistically significant (P < 0.05).

