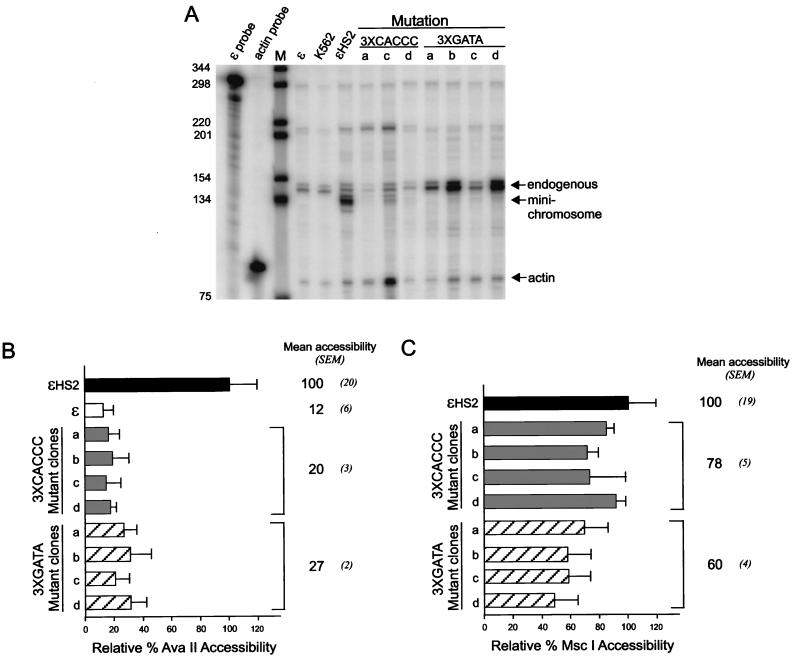
FIG. 7.
Transcription and restriction enzyme accessibility with multiple HS2 and promoter mutations. (A) RNase protection was used to measure the abundance of ɛ-globin transcripts, and the results for clones a to d with multiple CACCC site or GATA site mutations are shown. Lane M is as detailed in the legend to Fig. 4A. (B) Samples were processed as detailed in the legend to Fig. 3B by digestion with AvaII to determine promoter accessibility. The results for clones a to d are compared to the values for ɛ and ɛHS2 wild-type minichromosomes (see Materials and Methods). (C) Samples were processed as described above except that digestion was with MscI to determine HS2 accessibility.

