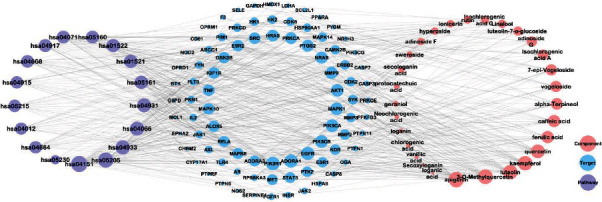
Figure 10.

Component-target-pathway (C-T-P) interaction network. The purple, pink, and blue nodes are the pathway, the component, and the target, respectively. The edges represent the relationship between pathway, component, and target. The size of the nodes in the figure is associated with the degree in the network.
