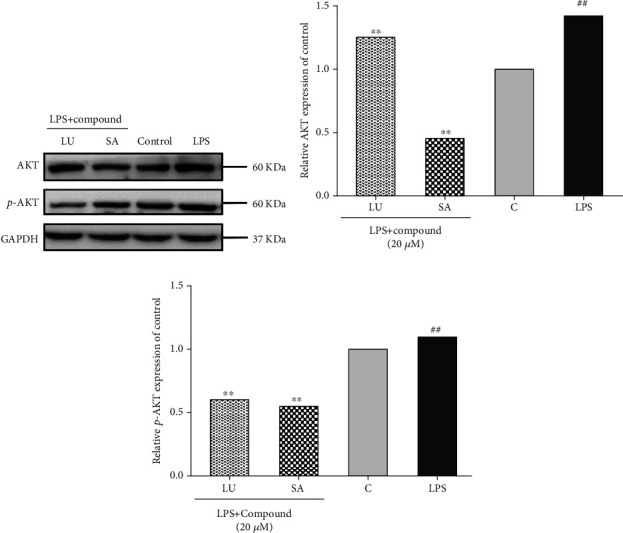
Figure 15.

Effect of luteolin and secologanic acid on the expression of AKT and p-AKT in LPS-induced RAW264.7. (a) AKT and p-AKT levels of RAW264.7 were analyzed by western blotting after incubation with LPS for 0.5 h. (b) Relative AKT expression of control. (c) Relative p-AKT expression of control. LU: luteolin; SA: secologanic acid; C: control. ##P < 0.01 versus untreated macrophage control. ∗∗P < 0.01 versus the LPS group.
