Figure 6.

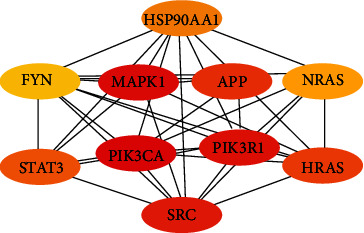
Top 10 genes' interaction network of Lonicerae japonicae flos. The nodes indicate proteins, and edges represent protein-protein associations. The depth of the color shade indicates the high degree of the node.

Top 10 genes' interaction network of Lonicerae japonicae flos. The nodes indicate proteins, and edges represent protein-protein associations. The depth of the color shade indicates the high degree of the node.