
Figure 8.
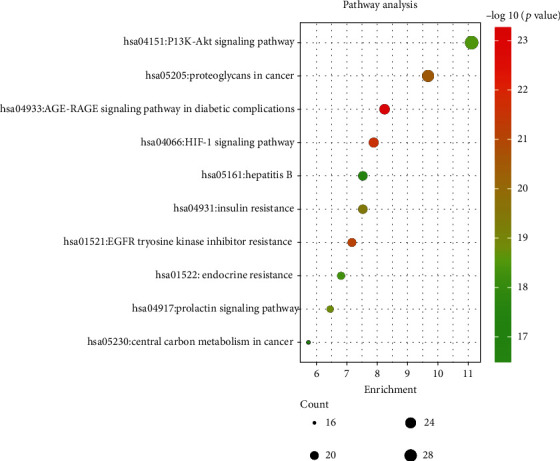
KEGG pathway enrichment with the top 10 P value. The y-axis stands for enriched pathways of the targets. The color of the bubble is associated with the P value, and the size is related to the enrichment number of targets.
Official websites use .gov
A
.gov website belongs to an official
government organization in the United States.
Secure .gov websites use HTTPS
A lock (
) or https:// means you've safely
connected to the .gov website. Share sensitive
information only on official, secure websites.
KEGG pathway enrichment with the top 10 P value. The y-axis stands for enriched pathways of the targets. The color of the bubble is associated with the P value, and the size is related to the enrichment number of targets.