Figure 10.

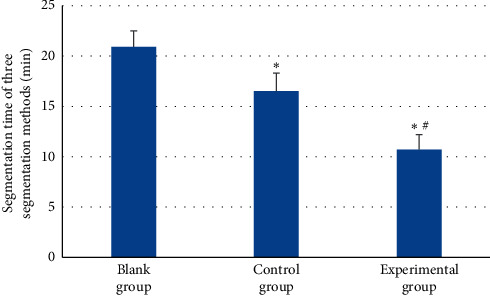
Contrast of running time of three segmentation algorithms. Note: the symbols ∗ and # indicate that the difference was substantial, versus the blank group and control group, respectively (P < 0.05).

Contrast of running time of three segmentation algorithms. Note: the symbols ∗ and # indicate that the difference was substantial, versus the blank group and control group, respectively (P < 0.05).