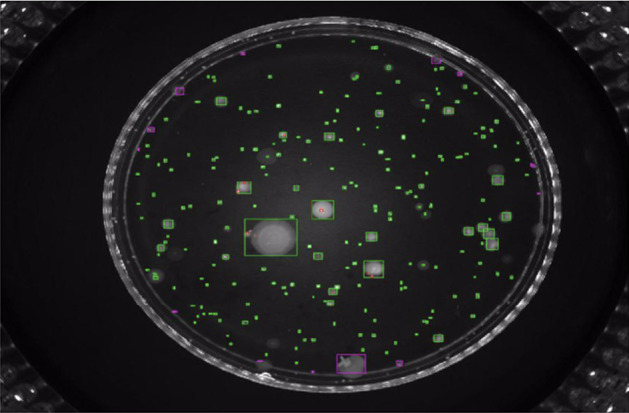
Fig. 17.

a Original image. b Image after thresholding at gray value 125. c Image after distance transform. d Image after region growing. e Image after component labelling. f Frequency distribution (in Mukherjee et al. (1995) Fig. 3). (Color figure online)
