Fig. 48.

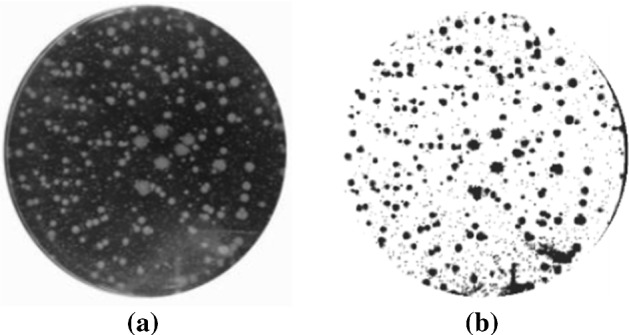
Comparison of gray-scale image and binary image. a Gray-scale image. b Binary image based on Otsu thresholding. (In Sánchez-Femat et al. (2016) Figs. 8, 9). (Color figure online)

Comparison of gray-scale image and binary image. a Gray-scale image. b Binary image based on Otsu thresholding. (In Sánchez-Femat et al. (2016) Figs. 8, 9). (Color figure online)