
Figure 3:
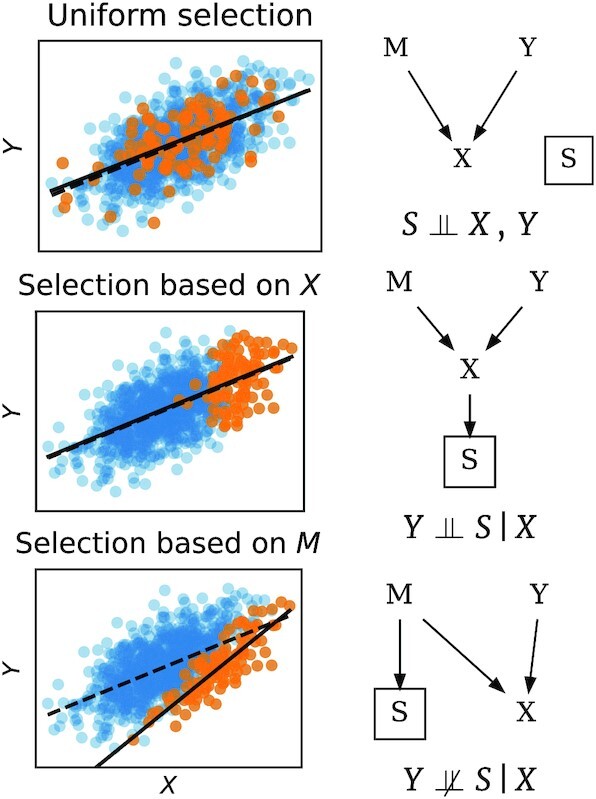
Sample selection bias: three examples. On the right are graphs giving conditional independence relations [40]. Y is the lesion volume to be predicted (i.e., the output). M are the imaging parameters, e.g., contrast agent dosage. X is the image, and depends both on Y and M (in this toy example X is computed as  , where ϵ is additive noise). S indicates that data are selected to enter the source dataset (orange points) or not (blue points). The symbol
  means independence between variables. Preferentially selecting samples results in a dataset shift (middle and bottom row). Depending on whether
  , the conditional distribution of
  —here lesion volume given the image—estimated on the selected data may be biased or not.