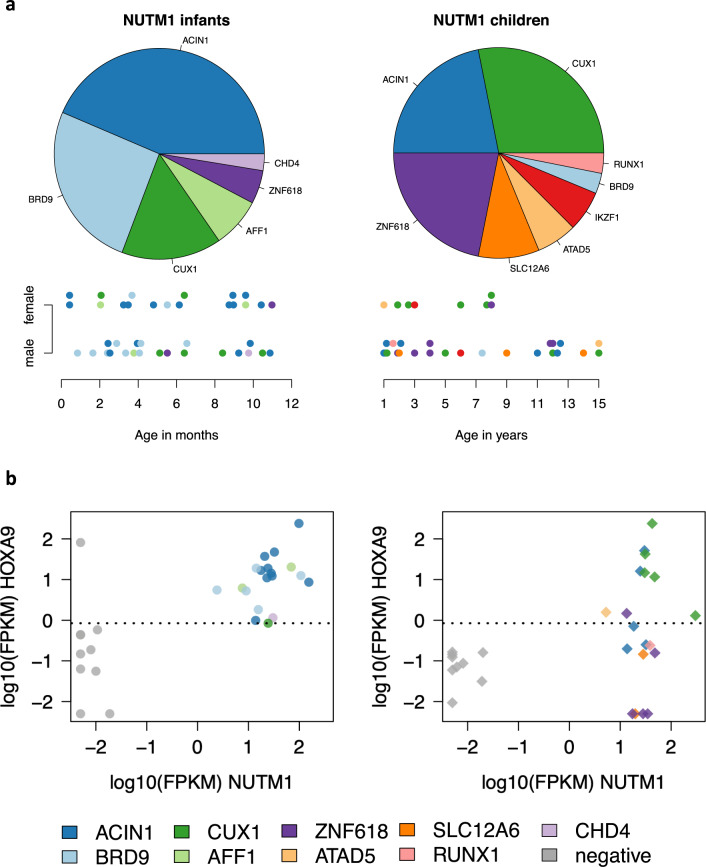
Fig. 2. Different NUTM1 partners in infants and children.
a Pie diagrams with the proportions of different NUTM1 partner genes among infants (N = 39; left) and children from the age of 1 (N = 32; right) with a known fusion partner. Below the pie diagrams, each patient is represented by a dot color-coded for the fusion, depicted along age at diagnosis (x-axis) for infants (in months; left) and children (in years; right) and gender (y-axis). Dots are plotted with a small offset to avoid overlap. b Dot plot showing NUTM1 and HOXA9 expression. Infant cases (N = 19; left panel) are indicated by a circle, pediatric cases (N = 19; right panel) by a diamond. Ten infants and nine children with B-ALL without NUTM1 or KMT2A rearrangement were included as controls (gray). Counts from RNA-sequencing libraries were normalized to fragments per kilobase per million (FPKM), 0 was substituted by 0.005, subsequently FPKM values were log10-transformed. The median HOXA9 expression across all 57 samples was 0.85 FPKM (log10 value–0.073), indicated by the dotted line.

