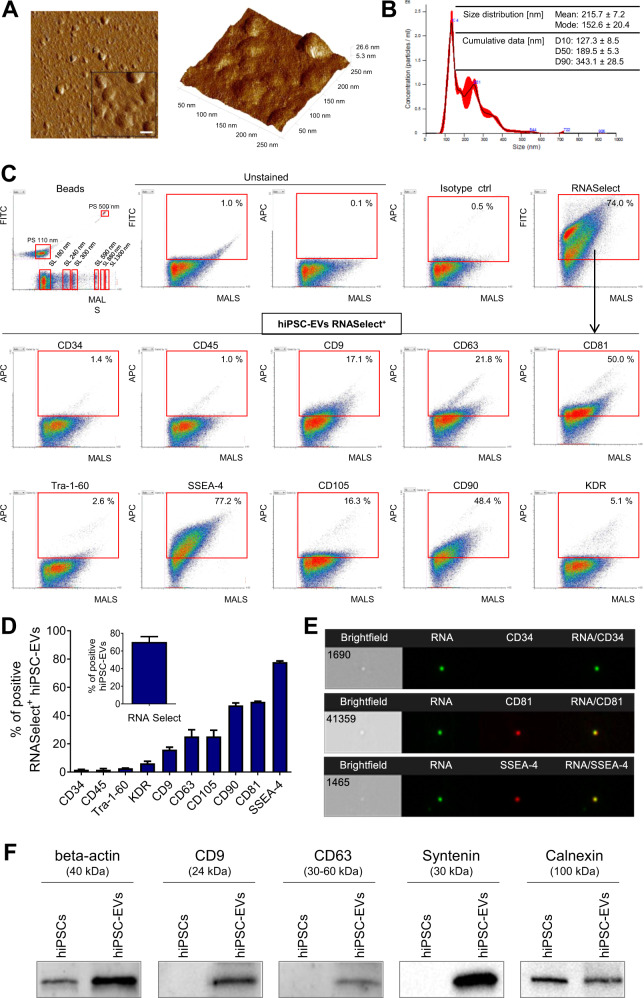
Fig. 1. Characterization of hiPSC-EVs.
A Representative atomic force microscopy (AFM) images of hiPS-derived EVs. Left: 2D image projection. The scale bar in the enlarged area indicates 50 nm. Right: 3D topography view of analyzed EVs with scan area 250 × 250 nm. B Nanoparticle tracking analysis of hiPSC-EVs samples. An exemplary particle size distribution plot obtained from sample measurement. The table contains data obtained from experimental repetitions and is presented as the mean ± SD (N = 3). The cumulative parameters D10, D50, and D90 indicate that 10%, 50% or 90% of the particles, respectively, have a diameter less than or equal to the given value. C Flow cytometry phenotyping. Representative dot plots of hiPSC-EVs samples stained with RNASelect dye and fluorescent antibodies were acquired by Apogee A50-Micro flow cytometer. The mixture of size-defined green polystyrene (PS) and silica (SL) Apogee calibration beads is shown as a size distribution reference. In gating strategy, only objects positive for RNASelect were included in the analysis of surface antigen expression. The percentage of objects positive for the analyzed markers is shown in red gates. MALS-medium angle light scatter parameter, corresponding to the relative size of analyzed particles. D Quantitative data for hiPSC-EVs phenotyping and presented as the mean ± SD from experimental repetitions (N = 3). E ImageStream Mk II analysis. Exemplary images of single hiPSC-EVs stained with RNASelect and selected antibodies, captured in brightfield and fluorescence channels. 60× magnification objective was used for the sample acquisition. F Western blotting analysis. Representative membrane images showing the expression of exosomal markers (CD9, CD63, syntenin), β-actin, and endoplasmic reticulum protein (calnexin) in hiPSC-EVs and their parental cells.

