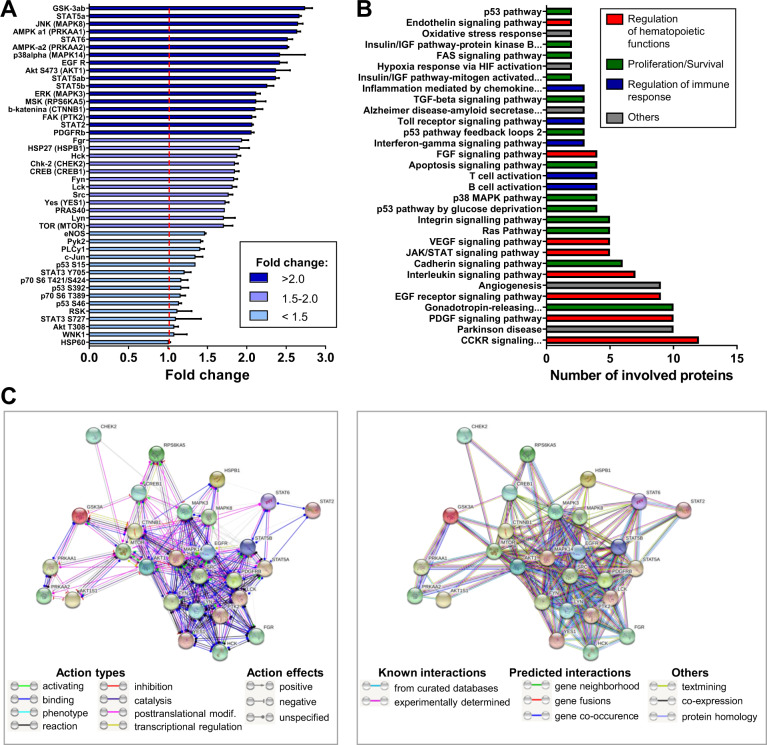
Fig. 7. Semiquantitative profiling of kinases phosphorylation in hiPSC-EVs-treated CB-HSPCs.
Prior experiment, cells were expanded for 7 days in the control medium without hiPSC-EVs and were subsequently treated with hiPSC-EVs for 2 h. Next, cell lysates were subjected to the assessment of protein phosphorylation by the Proteome Profiler Human Phospho-Kinase Array Kit. A Relative levels of protein phosphorylation on indicated amino acids are presented as a –fold change compared to the control (cells untreated with hiPSC-EVs). Data are presented as the mean ± SD (N = 2). The red line indicates the level of the control (expressed as 1). When few phosphorylation sites were analyzed within the same protein, a particular amino acid site was indicated. Alternative protein names are included in the brackets. The color coding of the graph bars corresponds to the phosphorylation level ranges as indicated on the graph legend. B PANTHER Pathway Overrepresentation Test. Only proteins with phosphorylation –fold change >1.5 were used in the analysis. The graph presents molecular pathways (PANTHER Pathways) that involve the indicated number of analyzed protein subsets. The color coding of the graph bars, indicated on the graph legend, corresponds to the subjective classification of pathways according to their predominant function in hematopoietic cells. C STRING analysis of the interaction between proteins (presented as spheres) used in the PANTHER analysis was performed in two modes. Left panel: “Molecular action” mode analysis. Line colors between proteins indicate the predicted mode of action, including action types or action effects. Right panel: “Evidence” mode analysis. Line colors between proteins indicate the type of interaction evidence, including known interactions, predicted interactions, or others.

