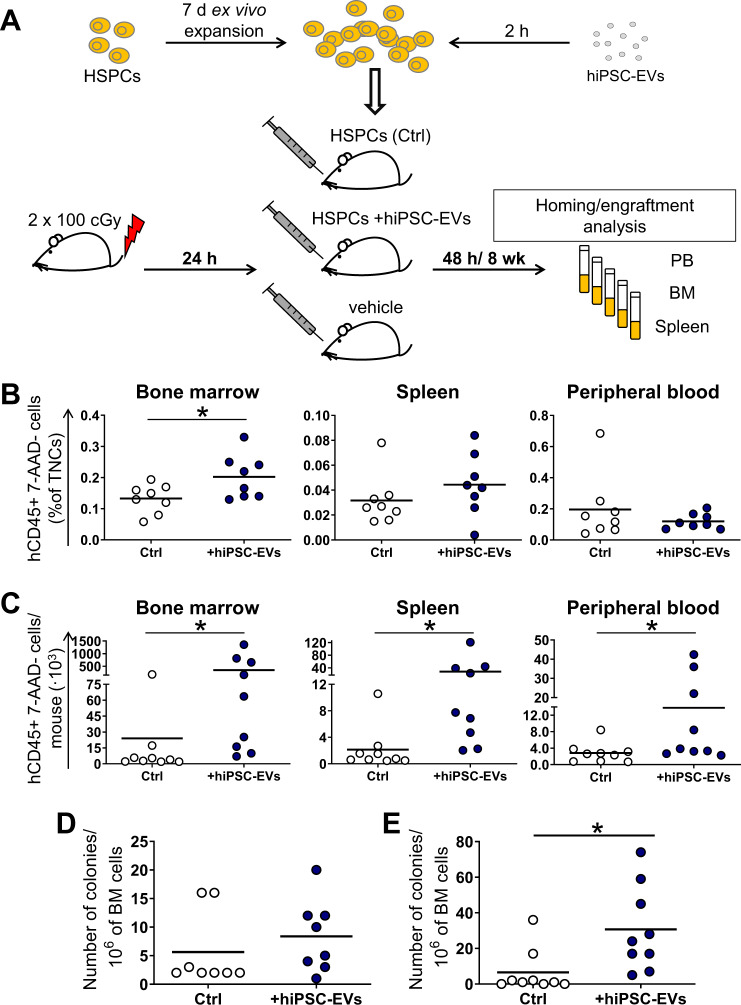
Fig. 8. Analysis of hiPSC-EVs influence on homing and engraftment of CB-HSPCs in vivo.
A Schematic layout of the experiment. Prior experiment, cells were expanded for 7 days in the control medium without hiPSC-EVs and were subsequently treated with hiPSC-EVs for 2 h. Untreated cells served as the control (Ctrl). Next, cells were transplanted into γ-irradiated NOD/SCID mice. After the transplantation, mice were sacrificed at 48 h (homing analysis; N = 8) or 8 weeks (engraftment analysis; N = 9), and their tissues were harvested. The number of live (7-AAD-) human hematopoietic (hCD45+) cells in BM, spleen, and PB isolated from mice 48 h (B) or 8 weeks (C) after the transplantation was analyzed by BD LSRFortessa flow cytometer and expressed as a percentage of the total nucleated cells (TNCs) or as the number of cells/mice, respectively. Each dot represents the results for individual animals. Black lines represent the mean value. *p < 0.05 for control vs. hiPSC-EVs-treated cells. D, E Colony-forming cell assay on BM cells isolated from transplanted mice. Data on the graph present the number of human hematopoietic colonies grown from the 106 of BM cells isolated from individual mice 48 h (D) or 8 weeks (E) after the transplantation. The black line represents the mean value. *p < 0.05 for control vs. hiPSC-EVs-treated cells, two-tailed Student’s t-test.

