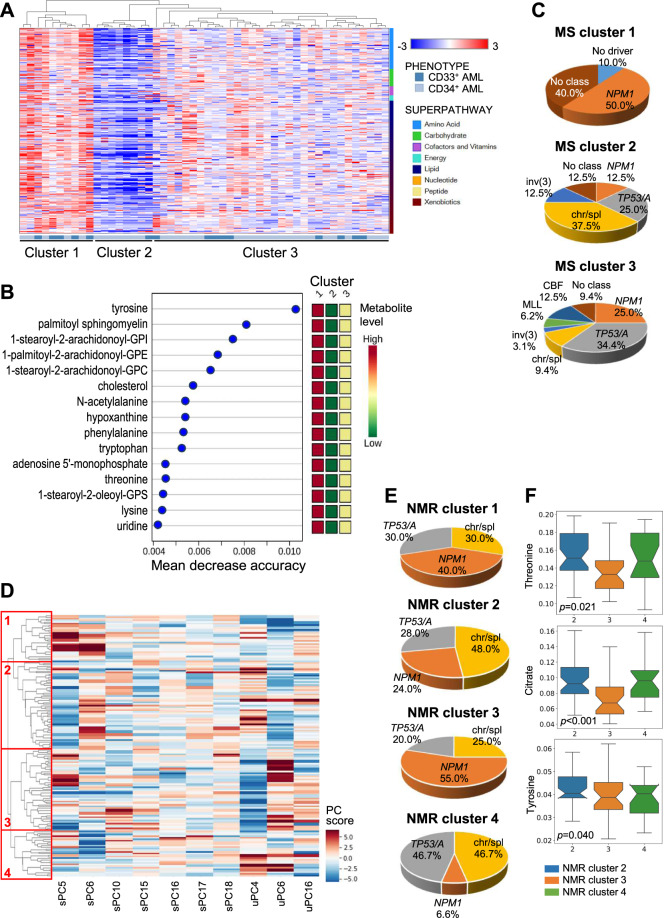
Fig. 5. Intracellular and biofluid metabolomics show association with AML molecular classification.
A Unsupervised hierarchical clustering of AML according to intracellular metabolomic profiles (MS, each row denotes a metabolite, each column a sample). B Top 15 metabolites contributing to separation of the three MS metabolic clusters (1, 2, 3). The metabolites belong to the following superpathways: amino acids and their derivatives (tyrosine, N-acetylalanine, phenilalanine, tryptophan, threonine, lysine), intermediates of purine and pyrimidine metabolism (hypoxanthine, adenosyne-5′-monophosphate, uridine) and lipids (sphingolipid, phosphatidylinositol, phosphatidylethanolamine, phosphatidylcholine, cholesterol, phosphatidylserine. Colored squares on the right indicate metabolite levels in each cluster. C Molecular classification of MS metabolic clusters [3]. Due to the low number of t(8;21) and inv(16)/t(16;16) cases, they were grouped in the core-binding factor (CBF) category and a t(6;9) patient with complex karyotype was included in the TP53/aneuploidy category (NPM1 NPM1-mut, chr/spl chromatin/spliceosome-mut, TP53/A TP53-mut/aneuploidy, inv(3) inv(3)/t(3;3), KMT2A KMT2A-rearranged). D Hierarchical clustering of AML patients belonging to the NPM1-mut, chromatin/spliceosome-mut or TP53/aneuploidy molecular classes according to biofluid metabolomic profile (NMR). These components were selected as the combination of urine and serum spectral features that best described the above mentioned genomic stratification. Of the ten features selected via stochastic gridsearch, seven came from serum spectra, indicating serum as the principal vector of information for this particular stratification. Colors indicate the score on each PC. E Molecular classification of NMR metabolic clusters. F Top scoring serum metabolites separating NMR clusters 2, 3, and 4. Signature metabolites were extracted from sera samples by selecting the highest scoring signals in terms of presence amongst the sera PC responsible for the best separation of molecular subgroups and the average of absolute values of their loadings. Statistical significance was obtained with SciPy.Stats Kruskal–Wallis H-test using stepdown Sidak correction. Notch width corresponds to the confidence interval of the median.

